


Ethereum (ETHUSD) Fluctuated Significantly on Oct 5: Key Variables Behind the Move
Ethereum (ETHUSD) is up 1.03% at Oct 5 22:20(ET), now at $2731.06, with a 7-day up of 1.89%.
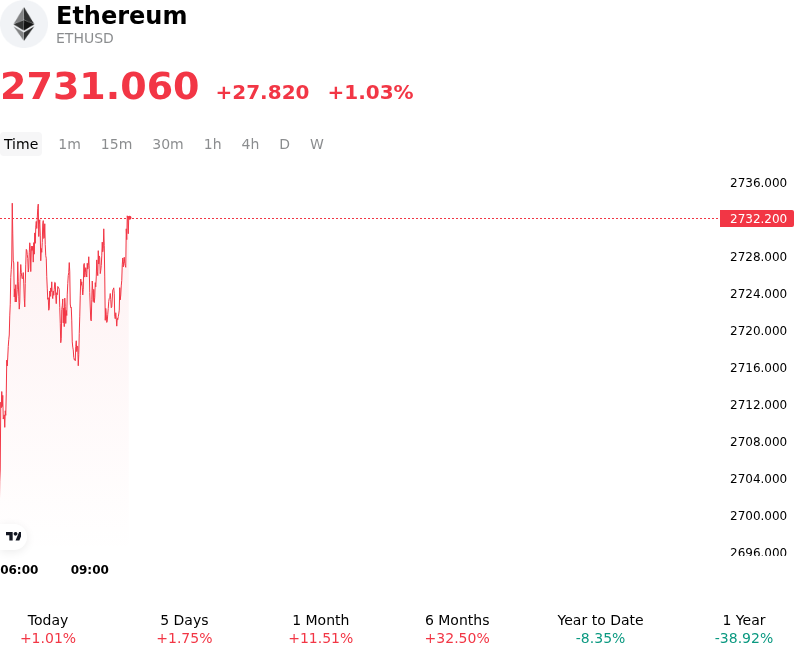
What is driving Ethereum (ETHUSD)’s stock price up today?
Positive momentum in Ethereum reflected a broader risk-on sentiment across digital asset markets as macroeconomic conditions turned favorable at the start of the fourth quarter. Investor expectations for a potential pause in Federal Reserve monetary policy tightening, alongside stabilizing U.S. Treasury yields and a softer U.S. dollar, helped ease global financial conditions. This improvement in macro liquidity provided institutional trading desks with the backdrop necessary to expand risk exposure into high-beta smart contract assets following quarter-end portfolio realignments.
Institutional demand through regulated spot Ethereum exchange-traded products remained a primary structural catalyst, absorbing circulating spot market supply and building a reliable price floor. Persistent spot absorption by institutional capital allocation funds mitigated selling pressure from retail venues. In the derivatives market, steady spot buying triggered orderly short covering and leverage rebalancing, returning perpetual funding rates to balanced, constructive levels without over-leveraging open interest.
Network-specific fundamentals further reinforced investor confidence. Continued expansion across Layer-2 scaling solutions and resilient total value locked within decentralized finance protocols underscored active on-chain transactional demand. Simultaneously, high staking participation rates locked a substantial portion of circulating supply into proof-of-stake contracts, tightening liquid exchange order books and reducing immediate sell-side availability. Positive sentiment was also buoyed by progress across testnet development milestones as the ecosystem advances toward scheduled mainnet upgrades.
The price movement represents a macro- and fundamental-driven advance supported by favorable global liquidity, spot ETF flows, and tight liquid supply. While structural dynamics favor continued strength, institutional investors remain attentive to broader macroeconomic releases, interest rate trajectories, and potential liquidity realignments within staking validation queues as ongoing risk factors.
Technical Analysis of Ethereum (ETHUSD)
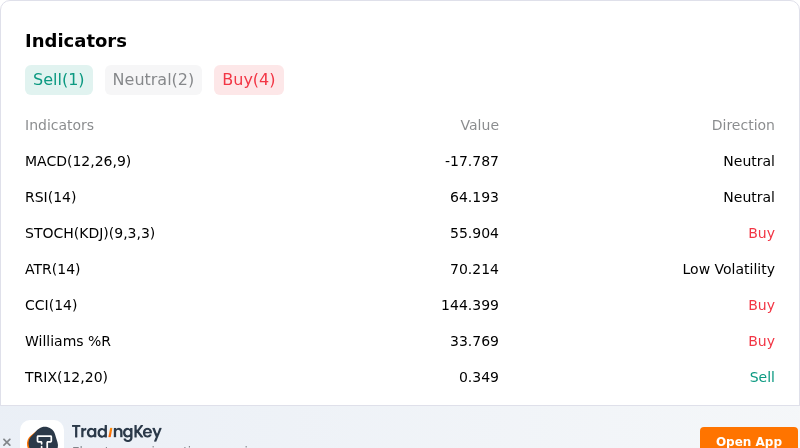
Technically, Ethereum (ETHUSD) shows a MACD (12,26,9) value of -17.787, indicating a neutral signal. The RSI at 64.193 suggests neutral condition and the Williams %R at 33.769 suggests buy condition. Please monitor closely.
More details about Ethereum (ETHUSD)
Recent Events and Risks:
- Institutional Spot ETF Net Outflows: U.S. spot Ethereum ETFs experienced a sharp reversal in institutional demand, recording over $118 million in aggregate net outflows across consecutive trading sessions, dampening spot market buying support and increasing near-term selling pressure.
- Leverage Position Unwinding and Liquidation Squeezes: Recent rapid price swings triggered dozens of millions of dollars in derivatives liquidations, as elevated leverage and short-term positioning across centralized exchanges leave ETHUSD vulnerable to cascading liquidations and heightened intraday volatility.
- Ecosystem Restructuring and Layer-2 Capital Unwinding: The announced shutdown of the Blast Layer-2 network has forced users to begin migrating capital back to Ethereum mainnet, creating operational friction and potential localized liquidity shocks as staked assets through protocols like Lido are unwound.
- Macro Risk-Off Sentiment and Technical Support Pressure: Weakening macroeconomic labor data and sustained elevated bond yields have dampened global appetite for risk assets, placing downward pressure on ETH and forcing price action to test key technical support levels near $2,645.
Recommended Articles


