


XRP (XRPUSD) Is up 1.22% on Oct 4: What Are the Risk Factors?
XRP (XRPUSD) is up 1.22% at Oct 4 20:55(ET), now at $1.4899, with a 7-day down of 2.19%.
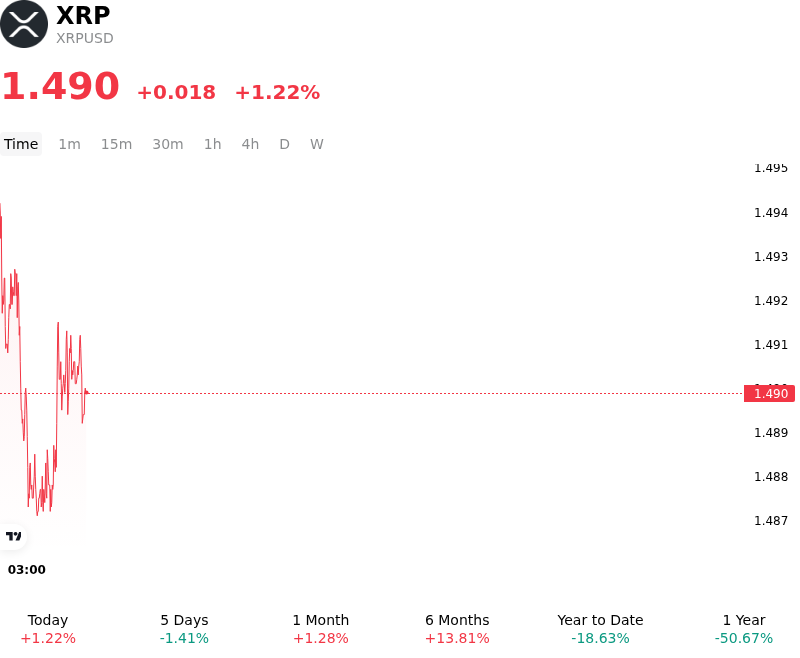
What is driving XRP (XRPUSD)’s stock price up today?
Capital flows into XRP advanced as market sentiment drew momentum from expanded institutional adoption initiatives and strategic ecosystem developments across key Asian financial hubs. A primary catalyst driving market upside has been the formal launch of XRP Asia during regional industry summits, featuring institutional participation from prominent regional banking partners to pilot credit and settlement infrastructure on the XRP Ledger. Concurrently, investor sentiment continues to be bolstered by growing corporate treasury activity, highlighted by upcoming equity listings designed to accumulate and hold substantial spot XRP reserves. These developments have reinforced long-term adoption expectations and broadened the asset's addressable market among institutional asset managers.
Underlying supply dynamics on centralized exchanges further amplified price volatility and upward liquidity pressure. On-chain data indicates a pronounced reduction in exchange balances, with significant token outflows moving into cold storage and institutional custody solutions. This contraction in circulating sell-side liquidity, paired with sustained institutional accumulation through spot XRP ETFs, has created a tighter order book environment. Even during periods of broader market consolidation, persistent ETF inflows and treasury reserve purchases have effectively absorbed marginal selling pressure, allowing spot prices to build momentum off key structural support levels.
Looking forward, technical and network upgrades planned for the XRP Ledger—including permission delegation and batch transaction processing—are further supporting developer activity and enterprise integration expectations. High-level institutional involvement from major global financial institutions and custody providers at upcoming corporate forums continues to elevate the asset's structural narrative within cross-border settlement and tokenization frameworks. While macro risks regarding Federal Reserve interest rate policy, elevated Treasury yields, and broad crypto-market risk sentiment remain active variables for market participants, XRP's strengthening institutional footprint and reduced liquid market supply present a resilient backdrop for continued spot accumulation.
Technical Analysis of XRP (XRPUSD)
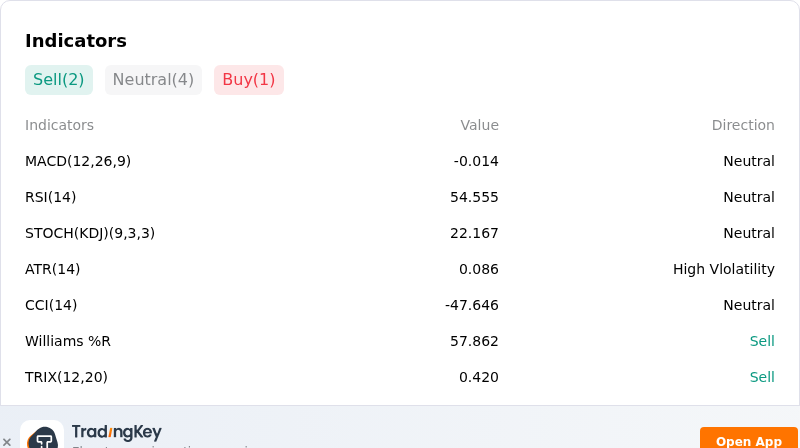
Technically, XRP (XRPUSD) shows a MACD (12,26,9) value of -0.014, indicating a neutral signal. The RSI at 54.555 suggests neutral condition and the Williams %R at 57.862 suggests sell condition. Please monitor closely.
More details about XRP (XRPUSD)
Recent Events and Risks:
- Ripple Escrow Unlocks and Supply Overhang: The scheduled release of 200 million XRP from Ripple's escrow account introduced nearly $298 million in token supply to the market, amplifying spot-side selling pressure and reviving immediate dilution concerns among traders.
- Technical Rejection at Overhead Resistance: XRP encountered repeated price rejections at the key $1.55–$1.58 resistance range, increasing the probability of a technical breakdown below fragile support at $1.47 toward lower demand zones around $1.30.
- Derivatives Over-Leverage and Long Liquidation Exposure: A notable surge in open interest across major derivatives exchanges created a heavily skewed leverage positioning, exposing the asset to aggressive long liquidation cascades if price action drops below key technical levels.
- Regulatory Stagnation and Macro Headwinds: Digital asset market sentiment continues to face headwinds following legislative stalemates on U.S. crypto market structure regulation, further exacerbated by rising Treasury yields that restrict institutional capital allocation into altcoins.
Recommended Articles


