


Ethereum (ETHUSD) Is up 1.02% on Oct 3: What Do On-Chain Data and Market Sentiment Show?
Ethereum (ETHUSD) is up 1.02% at Oct 3 14:00(ET), now at $2686.51, with a 7-day up of 0.45%.
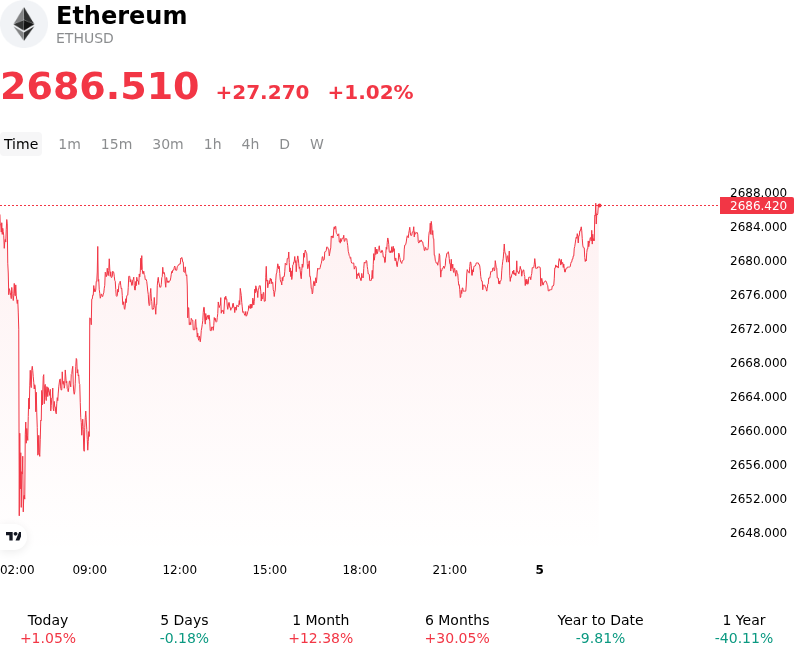
What is driving Ethereum (ETHUSD)’s stock price up today?
The upward price movement and heightened intraday volatility in Ethereum reflect a combination of short-covering in the derivatives market, technical support defense around key structural pivot levels, and resilient institutional interest following a strong quarterly baseline. As broader macro markets navigate shifting Federal Reserve interest rate expectations and elevated US Treasury yields, capital flows within the digital asset space have selectively favored major layer-one assets. Traders actively defended underlying support levels within the ongoing multi-week consolidation range, triggering a wave of liquidations among leveraged short positions in perpetual futures markets.
Derivatives positioning continues to exert a dominant influence on short-term price discovery relative to spot exchange volumes. Elevated open interest in perpetual futures generated a fragile market structure prone to sudden volatility spikes when localized buy stops were triggered above key technical resistance. Although spot Ethereum ETF flows have exhibited transient cooling following substantial quarterly net additions, institutional sentiment remains anchored by long-term adoption expectations, leading institutional desks to utilize intraday liquidity dips for strategic repositioning.
On-chain fundamentals and ecosystem developments provide additional structural support. Active address metrics and total value locked in decentralized finance protocols remain resilient, while ongoing reconfigurations within the layer-two ecosystem have highlighted mainnet Ethereum as the primary settlement and security layer. Furthermore, ongoing developer progress toward upcoming protocol upgrades continues to bolster long-term scaling and efficiency expectations among institutional investors.
Investors remain focused on macro risks, including persistent yield pressures from benchmark US Treasuries, potential regulatory updates regarding digital asset custody, and liquidity shifts tied to upcoming central bank communications. While current price behavior underscores robust demand at lower bounds and strong dip-buying activity, establishing a sustained breakout toward higher overhead resistance zones will necessitate a noticeable expansion in spot market buying accompanied by renewed momentum in institutional ETF inflows.
Technical Analysis of Ethereum (ETHUSD)
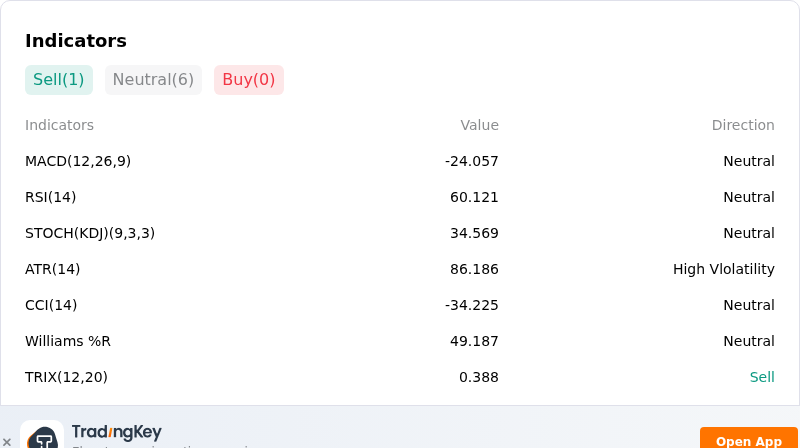
Technically, Ethereum (ETHUSD) shows a MACD (12,26,9) value of -24.057, indicating a neutral signal. The RSI at 60.121 suggests neutral condition and the Williams %R at 49.187 suggests neutral condition. Please monitor closely.
More details about Ethereum (ETHUSD)
Recent Events and Risks:
- Institutional ETF Capital Outflows: Spot Ethereum ETFs in the U.S. experienced multiple consecutive trading sessions of net outflows totaling over $117 million, breaking prior accumulation trends and removing crucial institutional buying support for ETHUSD.
- Leveraged Long Liquidation Cascades: A sharp intraday pullback triggered over $70 million in forced long liquidations, with additional whale long position liquidation levels clustered tightly between $2,613 and $2,630, creating severe downside risk if current support levels fail.
- Whale Distribution and Positive Exchange Netflows: On-chain tracking indicates large holders have shifted into a distribution phase, marked by multi-million-dollar OTC position exits and positive net transfers onto centralized exchanges, signaling heightened short-term sell pressure.
- Macro Headwinds and High-Beta De-risking: Weaker-than-expected economic reports alongside sustained strength in U.S. Treasury yields have driven cross-asset risk aversion, reducing market-maker depth and dampening speculative buy-side liquidity for Ethereum.
Recommended Articles


