


Wheat Futures (WHEAT-F) Is down 2.12% on Sep 25: Why It Happened
Wheat Futures (WHEAT-F) is down 2.12% at Sep 25 21:15(ET), now at $690.95, with a 7-day down of 3.22%.
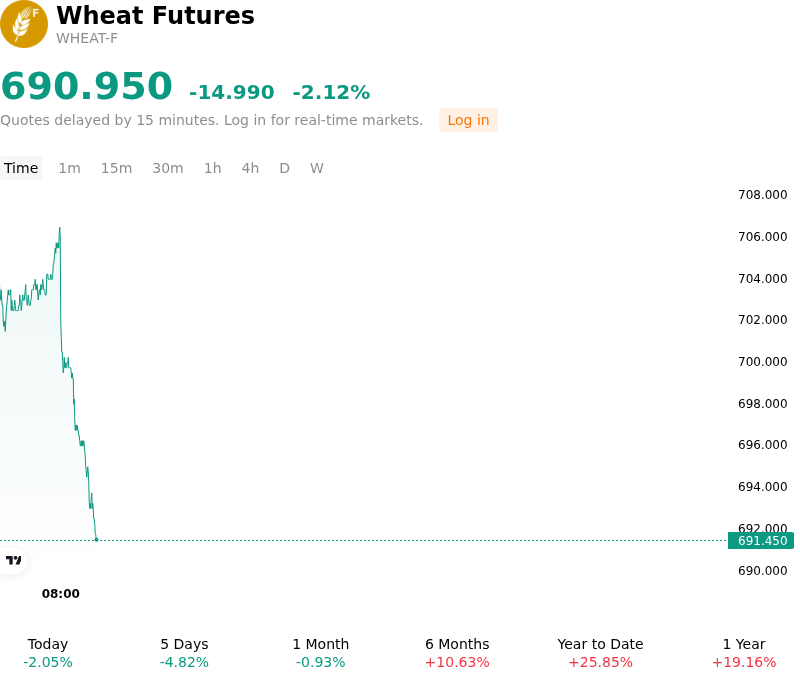
What is driving Wheat Futures (WHEAT-F)’s stock price down today?
Wheat futures came under notable downward pressure as a convergence of weak export demand signals, improving weather conditions across major U.S. growing regions, and technical profit-taking altered near-term market balances. A primary catalyst driving the sell-off was the release of disappointing weekly export sales data from the U.S. Department of Agriculture, which came in significantly below trade expectations. The muted booking volume underscored ongoing demand headwinds for U.S. supplies, as high local prices and strong competition from Black Sea and European originators continued to divert international buyers toward cheaper alternative sources.
Compounding the demand-side weakness, supply expectations for the upcoming crop year were bolstered by favorable weather forecasts across the U.S. Central and Southern Plains. Anticipated rainfall across key Hard Red Winter wheat producing areas provided crucial soil moisture, easing drought concerns ahead of peak winter wheat planting and emergence. The improved agronomic outlook reduced the immediate risk premium that had been embedded in futures contracts, prompting producers and speculative traders to adjust supply expectations upward for the coming season.
Macroeconomic and geopolitical factors further reinforced the bearish tone. A strengthening U.S. dollar added broader pressure across agricultural commodities by diminishing the relative competitiveness of U.S. exports. Speculative money managers engaged in technical selling and position unwinding, locking in profits after previous upward moves. At the same time, market participants digested ongoing diplomatic efforts regarding Black Sea trade corridors and alternative export logistics, which served to temporarily calm anxieties over immediate physical supply disruptions. While global inventory buffers remain sensitive to potential weather shifts and geopolitical headlines, the pullback reflects a necessary repricing driven by sluggish export pace and improving early-season growing conditions.
Technical Analysis of Wheat Futures (WHEAT-F)
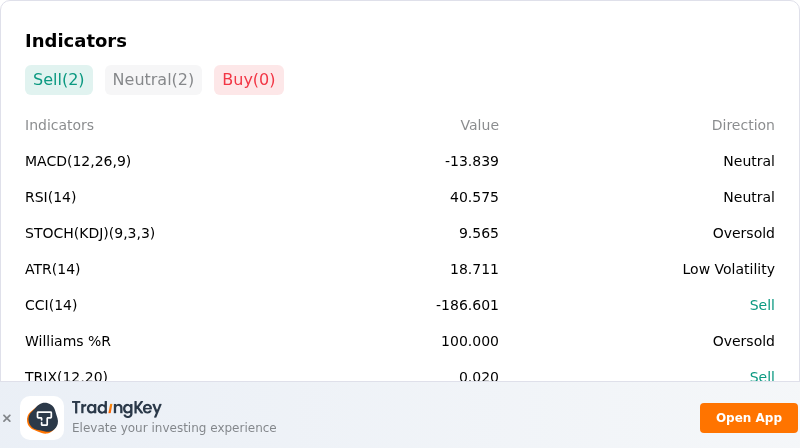
Technically, Wheat Futures (WHEAT-F) shows a MACD (12,26,9) value of -13.839, indicating a neutral signal. The RSI at 40.575 suggests neutral condition and the Williams %R at 100.000 suggests oversold condition. Please monitor closely.
More details about Wheat Futures (WHEAT-F)
Recent Events and Risks:
- Dismal Export Sales and Lagging Inspection Pace: The USDA Export Sales report revealed net weekly wheat export sales of just 267,553 metric tons, missing trader expectations of 350,000 to 600,000 metric tons and falling over 50% below year-ago levels, while overall marketing-year export inspections remain severely depressed.
- Black Sea Geopolitical Premium Unwind: Futures experienced sharp selling pressure as market participants took profits and unwound war-risk premiums following UN summit headlines, ongoing Turkish diplomatic efforts for safe grain transit, and reports of Russia preparing alternative Arctic export channels through Murmansk.
- Absence of Chinese Agricultural Demand: Market disappointment triggered long liquidation across the grain complex after anticipated "goodwill" buying of U.S. wheat by China failed to materialize ahead of high-level U.S.-China bilateral talks.
- Expanding Global Production and Seasonal Harvest Pressure: Upward global supply revisions—including higher output projections in Australia and Canada—alongside advancing U.S. winter wheat planting progress and beneficial rains in key growing belts continue to cap upside potential and apply seasonal downward pressure on futures.
Recommended Articles


