


WTI Futures (USOIL-F) Volatility Intensified on Sep 24: What to Watch
WTI Futures (USOIL-F) is up 2.07% at Sep 24 04:30(ET), now at $94.58, with a 7-day down of 1.97%.
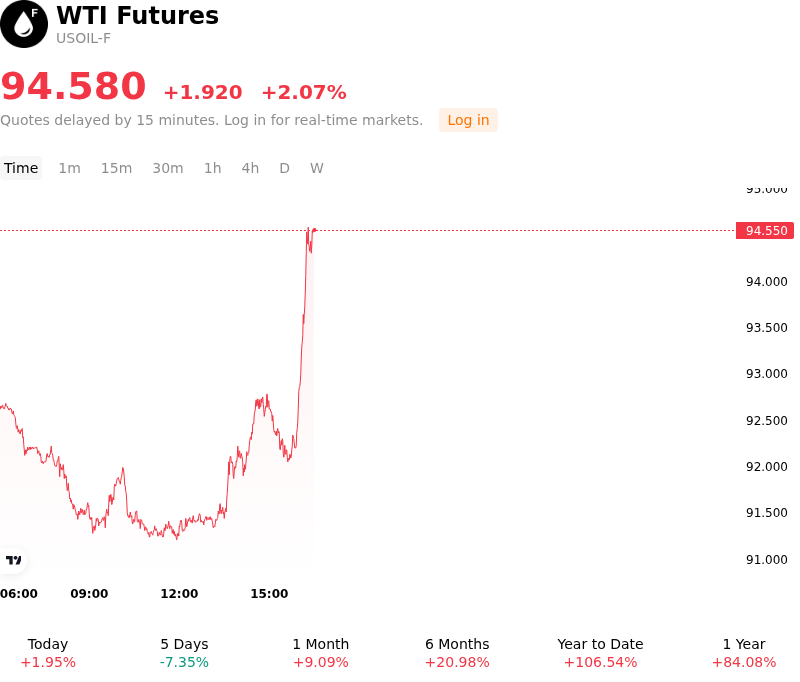
What is driving WTI Futures (USOIL-F)’s stock price up today?
U.S. benchmark crude futures moved higher as geopolitical supply risk premiums resurfaced, overriding short-term commercial inventory accumulation. Market sentiment was primarily anchored by persistent friction in the Middle East and lingering threats to maritime transit through critical supply chokepoints, notably the Strait of Hormuz. Although diplomatic engagements and prospective supply mitigation efforts had induced a brief correction in preceding sessions, institutional participants rapidly re-priced the structural vulnerability of regional crude exports. The inability to secure an immediate and complete normalization of Middle Eastern shipments reinforced fears of sustained physical tightness, prompting traders to rebuild risk premia across prompt contracts.
The upward momentum was further supported by tight underlying dynamics in refined product markets, which offset the headline U.S. crude inventory data. While the U.S. Energy Information Administration reported an unexpected weekly build in commercial crude stocks due to a seasonal decline in domestic refinery utilization, refined product balances painted a significantly tighter picture. Notable weekly drawdowns in U.S. gasoline and distillate inventories underscored firm end-user consumption and restricted refining capacity. Exceptionally robust refining crack spreads and depleted product stockpiles continued to provide a structural backstop to crude demand, encouraging refiners to maintain firm procurement expectations despite temporary inventory builds.
From a structural perspective, the energy complex remains anchored by steep backwardation in prompt futures curves, signaling tight near-term physical availability relative to long-dated horizons. Institutional positioning shifted toward short-covering and systemic dip-buying as prices defended key technical support levels following the prior pullback. While broader macroeconomic pressures—including U.S. dollar strength—exerted moderate overhead resistance, institutional capital flows prioritized hedging tail risks associated with global supply chain disruptions. Market participants remain focused on tracking regional export volumes, maritime shipping safety, and upcoming refinery turnarounds to assess the longevity of the price rebound.
Technical Analysis of WTI Futures (USOIL-F)
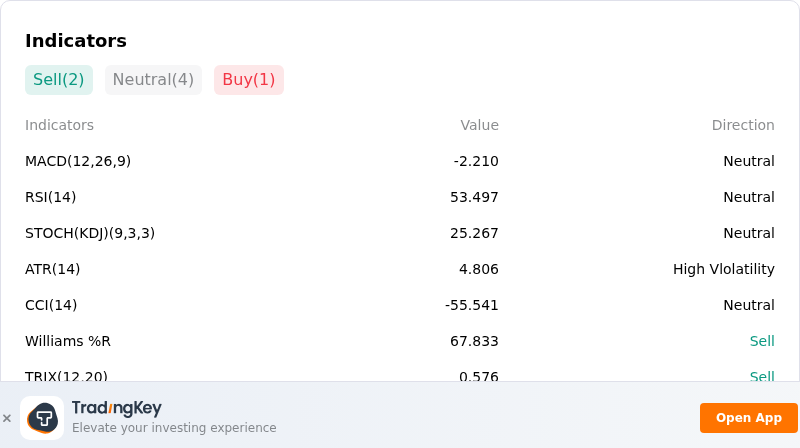
Technically, WTI Futures (USOIL-F) shows a MACD (12,26,9) value of -2.229, indicating a neutral signal. The RSI at 53.302 suggests neutral condition and the Williams %R at 68.667 suggests sell condition. Please monitor closely.
More details about WTI Futures (USOIL-F)
Recent Events and Risks:
- Unexpected U.S. Commercial Crude Inventory Build: The U.S. Energy Information Administration reported a surprise build of 2.969 million barrels in commercial crude stockpiles for the week ending September 18, defying market consensus expectations of a 700,000-barrel draw and creating immediate downside volatility risk for WTI futures.
- Storage Accumulation at Cushing Delivery Hub: U.S. crude stocks at the Cushing, Oklahoma delivery point for WTI futures jumped by over 2.2 million barrels to reach 23.7 million barrels, signaling easing domestic inland tightness and threatening further price weakness as spot supplies expand.
- Geopolitical Risk Premium Unwind on Diplomatic Signal: Intraday crude prices faced selling pressure as market participants began unwinding geopolitical risk premiums following indications that Iran is reviewing U.S. diplomatic peace proposals to reopen the Strait of Hormuz and de-escalate Persian Gulf conflicts.
- Refinery Processing Run Reductions: Weekly EIA data revealed domestic crude oil intake by U.S. refineries fell by 519,000 barrels per day as capacity utilization rates dropped by 2.8 percentage points to 94%, weakening physical crude purchasing from domestic refiners and reinforcing downside price pressures.
Recommended Articles


