


USD/MXN (USDMXN) Is up 0.50% on Sep 22: Are Market Expectations Adjusting?
USD/MXN (USDMXN) is up 0.50% at Sep 22 11:45(ET), now at $17.30115, with a 7-day up of 0.93%.
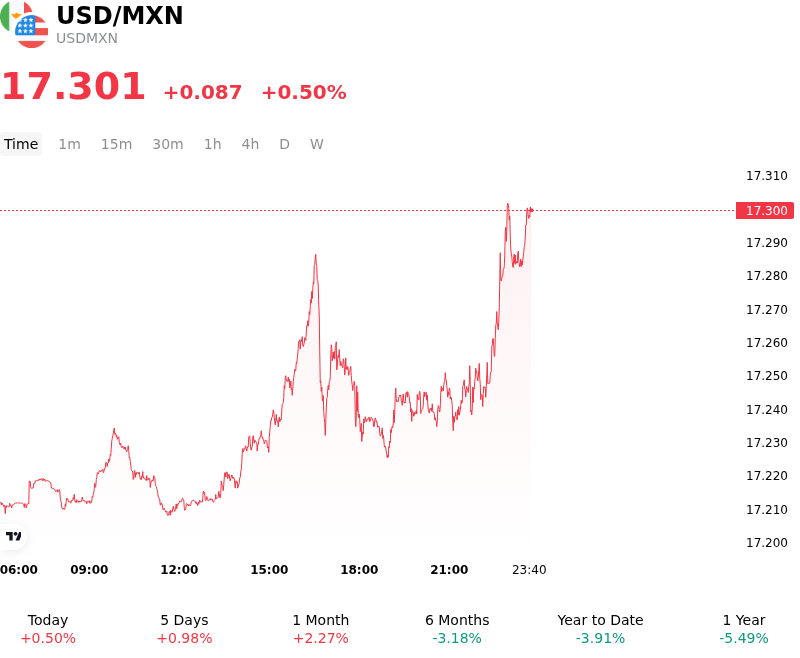
What is driving USD/MXN (USDMXN)’s stock price up today?
The US dollar gained ground against the Mexican peso as foreign exchange markets digested the ongoing compression in the interest-rate differential between the Federal Reserve and Banco de México. The Fed's recent monetary policy tightening narrowed the spread between US and Mexican benchmark interest rates, eroding a portion of the yield advantage that has historically underpinned carry-trade demand for the peso. Elevated US Treasury yields continued to support institutional capital flows into greenback-denominated assets, reducing the relative attractiveness of high-yielding emerging market currencies.
Pre-meeting positioning ahead of Banco de México's upcoming monetary policy decision introduced additional downward pressure on the peso. Market participants evaluated whether Banxico would maintain its policy rate or signal future easing in light of mixed domestic macroeconomic performance. Recent Mexican economic indicators revealed softening industrial output and weakening manufacturing employment, highlighting structural challenges in the real economy. As domestic disinflation continues to progress, expectations that Banxico's rate trajectory will eventually uncouple from the Fed's firmer stance have shifted relative monetary policy expectations in favor of the dollar.
External risk sentiment and energy price volatility also contributed to the upward momentum in USDMXN. Elevated global energy costs and broader macroeconomic uncertainty kept risk tolerance restrained across international capital markets. This environment prompted portfolio managers to trim exposure to Latin American currencies and reallocate capital into liquid reserve assets. Although Mexico's medium-term structural fundamentals and trade integration with North America remain intact, short-term FX dynamics are being primarily dictated by interest-rate repricing, yield differential dynamics, and cautious cross-border positioning.
Technical Analysis of USD/MXN (USDMXN)
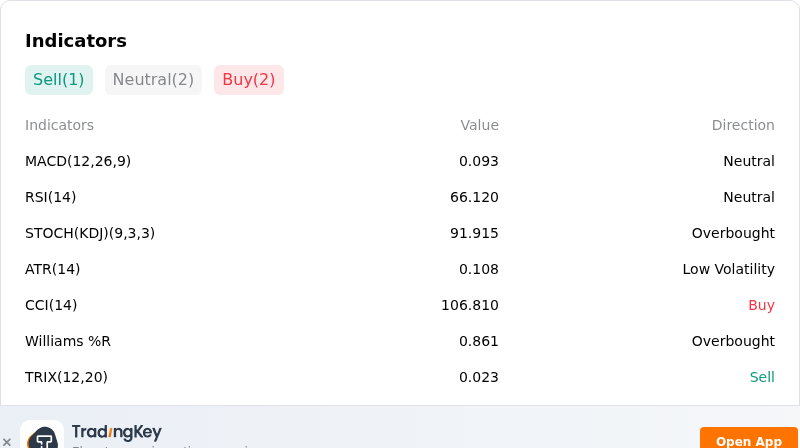
Technically, USD/MXN (USDMXN) shows a MACD (12,26,9) value of 0.093, indicating a neutral signal. The RSI at 66.120 suggests neutral condition and the Williams %R at 0.861 suggests overbought condition. Please monitor closely.
More details about USD/MXN (USDMXN)
Recent Events and Risks:
- Narrowing US-Mexico Rate Differential: Resilient U.S. yield dynamics alongside the Federal Reserve's hawkish policy stance compared to Banco de México's policy pause have compressed the U.S.-Mexico rate spread, increasing the risk of carry-trade unwinds and upside volatility for USD/MXN.
- Domestic Inflation Easing and Rate Cut Speculation: Cooling core inflation metrics in Mexico have heightened market expectations for dovish monetary policy adjustments by Banxico, driving institutional profit-taking on peso exposures and diminishing the currency's yield advantage.
- USMCA Trade Friction and Tariff Exposure: Persistent bilateral trade policy uncertainty and potential tariff risks surrounding North American supply chains weigh heavily on Mexico's foreign trade outlook, leaving the peso vulnerable to trade-driven risk aversion.
- Institutional Governance and Legal Uncertainty: Implementation risks surrounding constitutional and judicial reforms in Mexico continue to elevate country-risk premiums and impair foreign direct investment projections, worsening near-term MXN downside exposure.
Recommended Articles


