


Bank of America Corp Stock (BAC) Closed Down by 3.04% on Sep 22: Key Drivers Unveiled
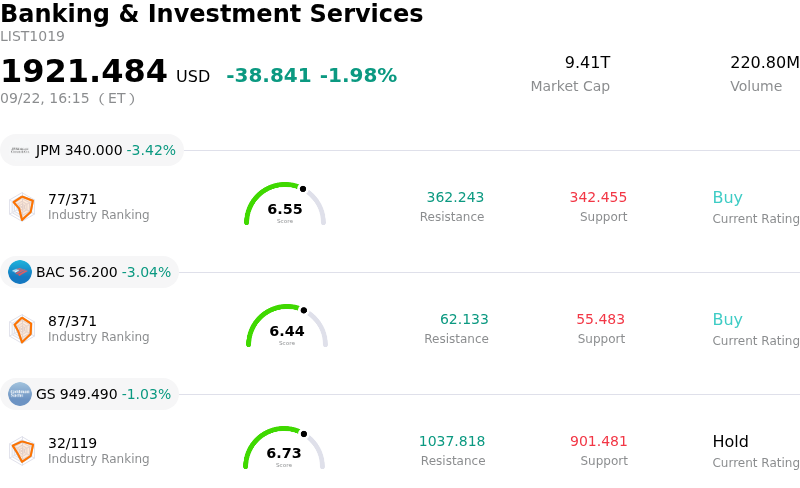
Bank of America Corp (BAC) closed down by 3.04%. The Banking & Investment Services sector is down by 1.98%. The company underperformed the industry. Top 3 stocks by turnover in the sector: JPMorgan Chase & Co (JPM) down 3.42%; Bank of America Corp (BAC) down 3.04%; Goldman Sachs Group Inc (GS) down 1.03%.
What is driving Bank of America Corp (BAC)’s stock price down today?
Bank of America experienced notable downward pressure and heightened intraday volatility as a broader selloff in the financial sector weighed on major money-center institutions. A key macroeconomic driver of this sector-wide de-risking has been the ongoing dynamic in the bond market, where persistent inflation concerns have sustained high Treasury yields while keeping the yield curve relatively flat. This environment compresses expectations for bank net interest margins, prompting institutional investors to trim exposure to rate-sensitive financial equities and rotate capital into other sectors.
Adding to sector-wide headwinds, sentiment surrounding Bank of America remains cautious following management commentary regarding third-quarter financial performance. Chief Executive Officer Brian Moynihan signaled a deceleration in capital markets activity, warning that third-quarter investment banking fees could decline by more than ten percent year over year, while sales and trading revenue is projected to be roughly flat. Because the institution had previously built strong momentum in investment banking and trading, this softer guidance triggered downward earnings revisions among analysts and prompted institutional portfolio managers to reprice near-term expectations.
From an institutional strategy perspective, recent portfolio adjustments reflect a broader shift toward risk management and asset reallocation. While the bank's underlying commercial franchise, deposit base, and lending operations remain fundamental backstops, elevated funding costs and credit risks linked to restrictive monetary conditions continue to generate volatility. Market participants are increasingly focused on whether full-year net interest income resilience can counterbalance the slowdown in Wall Street fee generation, keeping the stock sensitive to macro headlines ahead of the upcoming quarterly earnings report.
Technical Analysis of Bank of America Corp (BAC)
Technically, Bank of America Corp (BAC) shows a MACD (12,26,9) value of -1.229, indicating a sell signal. The RSI at 25.730 suggests sell condition and the Williams %R at 99.869 suggests oversold condition. Please monitor closely.
Media Coverage of Bank of America Corp (BAC)
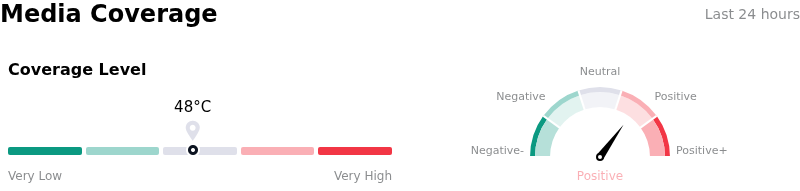
In terms of media coverage, Bank of America Corp (BAC) shows a coverage score of 48, indicating a moderate level of media attention. The overall market sentiment index is currently in bullish zone.
Fundamental Analysis of Bank of America Corp (BAC)
Bank of America Corp (BAC) is in the Banking & Investment Services industry. Its latest annual revenue is $104.06B, ranking 2 in the industry. The net profit is $29.05B, ranking 2 in the industry. Company Profile
Over the past month, multiple analysts have rated the company as Buy, with an average price target of $67.67, a high of $76.00, and a low of $48.00.
More details about Bank of America Corp (BAC)
Company Specific Risks:
- Investment Banking Guidance Downgrade: Management announced Q3 investment banking fee projections of $1.6 billion to $1.8 billion, representing a greater than 10% year-over-year decline that missed consensus estimates of $2.0 billion, while guiding sales and trading revenues to remain flat.
- Expanding Portfolio Paper Losses: Rising yields widened unrealized paper losses on the bank's low-coupon debt securities portfolio past $90 billion, suppressing tangible common equity metrics and restricting capital flexibility for share repurchases.
- Sub-optimal Deal Segment Positioning: Executive commentary revealed that the bank holds lower market share in currently active capital market deal verticals, exposing the franchise to steeper revenue pullbacks relative to bulge-bracket peers.
Recommended Articles


