


Ethereum (ETHUSD) Is down 1.53% on Sep 22: What Are the Risk Factors?
Ethereum (ETHUSD) is down 1.53% at Sep 22 21:05(ET), now at $2739.37, with a 7-day up of 13.88%.
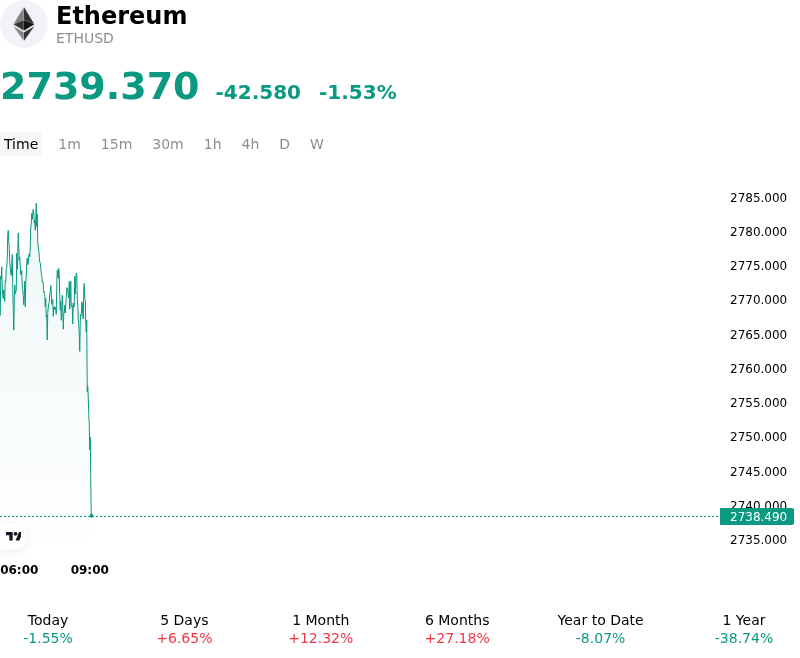
What is driving Ethereum (ETHUSD)’s stock price down today?
Ethereum experienced a modest pullback as market participants engaged in profit-taking following a multi-day rally that tested key overhead resistance levels near short-term technical hurdles. The intraday decline reflects a healthy liquidity consolidation after derivative markets reached overextended leverage conditions. As buying momentum lost steam near critical resistance, high-leverage long positions were forced to unwind, triggering short-term order book pressure and temporary liquidity displacement across spot and perpetual swap markets.
Institutional participation presented a mixed picture, with spot Ethereum exchange-traded fund flows moderating after a period of steady accumulation. While long-term institutional treasury adoption remains structural, short-term capital flows temporarily rotated back toward market anchors like Bitcoin or lower-cap execution layers. This capital reallocation reduced immediate spot demand for Ether, allowing tactical traders and quantitative strategies to lock in gains. Additionally, elevated yields on U.S. Treasuries continue to apply pressure on non-yielding digital assets, tempering broader risk-on sentiment across global markets.
From an on-chain perspective, core network fundamentals remain intact, with steady staking participation and sustained Layer-2 ecosystem activity providing a structural floor. However, fee burn rates and decentralized finance transactional volume slowed slightly during the session, offering little fundamental catalyst to push prices through near-term resistance. Investors continue to monitor upcoming Federal Reserve policy communications, broader macroeconomic liquidity conditions, and spot ETF net flow trends to determine whether this move represents a temporary event-driven consolidation or the beginning of a deeper range-bound retest.
Technical Analysis of Ethereum (ETHUSD)
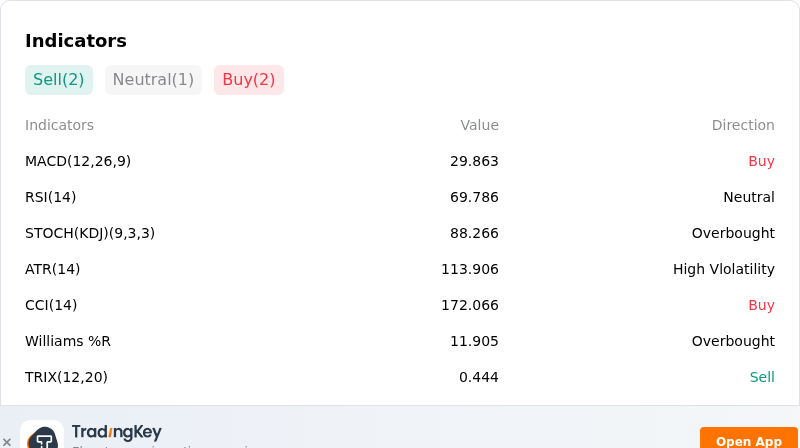
Technically, Ethereum (ETHUSD) shows a MACD (12,26,9) value of 29.863, indicating a buy signal. The RSI at 69.786 suggests neutral condition and the Williams %R at 11.905 suggests overbought condition. Please monitor closely.
More details about Ethereum (ETHUSD)
Recent Events and Risks:
- Spot ETF Capital Outflows: U.S. spot Ethereum ETFs experienced significant net capital withdrawals, shedding over $140 million in a single week with consecutive daily outflows across major institutional funds, reflecting reduced institutional risk appetite and spot demand pressure.
- Legislative Regulatory Setbacks: The failure of the U.S. Senate to advance key digital asset legislation (the CLARITY Act) injected regulatory uncertainty into the market, triggering sharp crypto-wide sell-offs and over $180 million in long position liquidations for ETH derivatives.
- Protocol and Restaking Exploits: Recent security breaches across Ethereum-linked infrastructure—including an exploit targeting liquid restaking token rsETH—have elevated custody and smart contract risk concerns, threatening liquidity in decentralized finance (DeFi) derivatives.
- Whale Offloading and Technical Overhead Pressure: On-chain tracking reveals large wallet holders actively offloading concentrated ETH holdings and taking profits near upper resistance around $2,650–$2,700, raising the risk of intraday liquidation cascades down toward key moving average support levels.
Recommended Articles


