


BNB (BNBUSD) Is down 1.36% on Sep 22: What Do On-Chain Data and Market Sentiment Show?
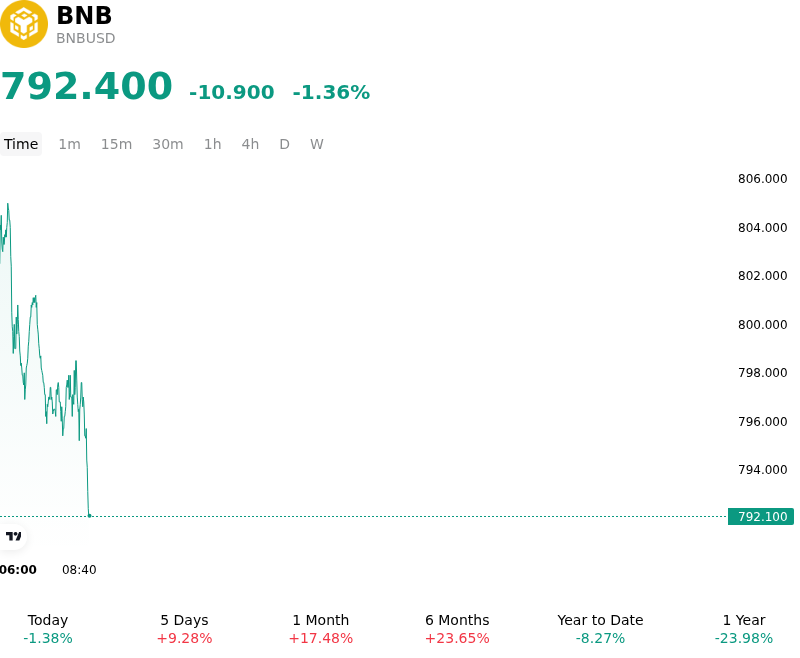
BNB (BNBUSD) is down 1.36% at Sep 22 21:00(ET), now at $792.4, with a 7-day up of 11.12%.
What is driving BNB (BNBUSD)’s stock price down today?
The pullback in BNB reflects a combination of short-term profit taking, derivative market de-risking, and broader consolidation across the digital asset space. Following a period of upward momentum, market participants adjusted their risk exposure, leading to modest liquidity contraction across major altcoin trading pairs. As macroeconomic conditions induced cautious sentiment across global risk assets, leveraged long positions in BNB futures experienced targeted unwinding, putting localized downward pressure on spot market valuations.
Fundamental drivers within the BNB Chain ecosystem also contributed to the softer market stance. A temporary moderation in decentralized finance activity and daily transaction volumes reduced short-term gas demand and token burn velocity, marginally dampening spot utility dynamics. Concurrently, capital flows across institutional channels demonstrated a preference for primary collateral assets, causing a slight capital rotation away from major exchange-native and Layer-1 alternative tokens.
Regulatory oversight and macroeconomic liquidity factors remain key considerations for institutional allocators. Ongoing scrutiny surrounding global exchange operations and regional compliance frameworks continues to induce periodic risk-off sentiment in exchange-linked digital assets. While structural token burn mechanisms and network efficiency upgrades continue to support long-term adoption expectations, the asset remains susceptible to short-term pullbacks during periods of macro policy repricing and derivative positioning cleanups.
Technical Analysis of BNB (BNBUSD)
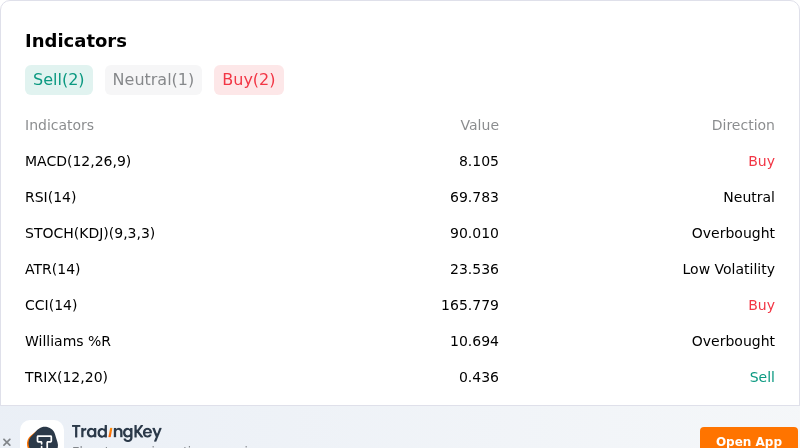
Technically, BNB (BNBUSD) shows a MACD (12,26,9) value of 8.284, indicating a buy signal. The RSI at 70.323 suggests buy condition and the Williams %R at 9.345 suggests overbought condition. Please monitor closely.
More details about BNB (BNBUSD)
Recent Events and Risks:
- Overhead Resistance and Volume Thinning: Rejection at the $770–$780 primary resistance zone alongside low daily spot turnover ratios increases the risk of a technical pullback, with downside targets threatening a retest of support levels around $708–$710 if buying momentum falters.
- European Regulatory Uncertainty Under MiCA: Ongoing uncertainty regarding Binance's EU-wide operational authorization and licensing compliance under the Markets in Crypto-Assets (MiCA) framework continues to generate institutional caution and regulatory overhang for BNB.
- Leveraged Liquidation Clusters Below Key Support: Concentrated leverage and dense long-side liquidation clusters positioned near the $709–$710 and $695–$703 price bands leave BNB vulnerable to sharp intraday downside volatility and forced liquidations if immediate support boundaries give way.
- Exchange Margin Delistings and Liquidity Unwinds: Recent and scheduled delistings of select leveraged and margin trading pairs on the Binance platform require automated position closures and collateral reallocations, adding localized trading friction and risk-off sentiment across Binance ecosystem tokens.
Recommended Articles


