


Equinor ASA Stock (EQNR) Moved Down by 3.38% on Sep 21: Key Drivers Unveiled
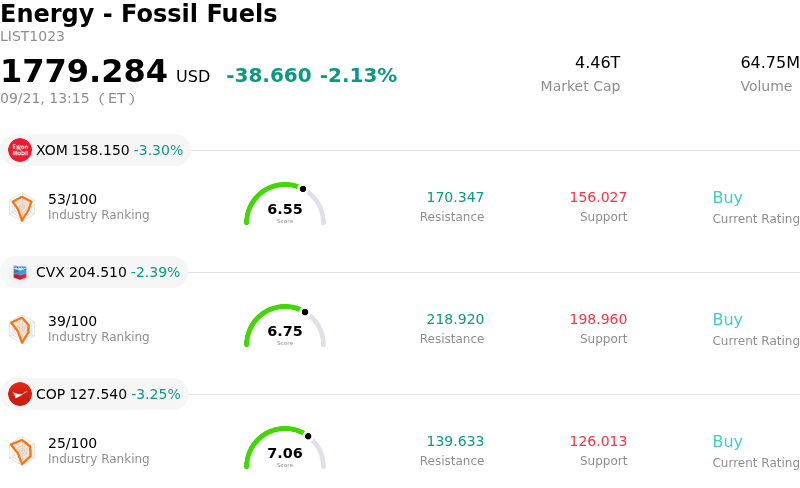
Equinor ASA (EQNR) moved down by 3.38%. The Energy - Fossil Fuels sector is down by 2.13%. The company underperformed the industry. Top 3 stocks by turnover in the sector: Exxon Mobil Corp (XOM) down 3.30%; Chevron Corp (CVX) down 2.39%; ConocoPhillips (COP) down 3.25%.
What is driving Equinor ASA (EQNR)’s stock price down today?
Equinor ASA experienced downward price pressure primarily driven by a pullback in global benchmark crude oil and natural gas prices. Following recent rallies across commodity markets, a broader retracement in energy futures generated sector-wide selling pressure. As a major European energy producer with significant earnings sensitivity to international crude and European gas realizations, softening raw commodity pricing directly weighed on market sentiment, dragging down large-cap energy equities across global exchanges.
Adding to the day's movement, valuation considerations prompted institutional profit-taking. Having recently traded near upper technical boundaries and above historical valuation multiples, market commentary pointed to elevated valuation risks relative to long-term intrinsic estimates. Mixed institutional portfolio rebalancing further reflected cautious positioning among asset managers. This profit-taking coincided with broader weakness across European benchmark indices, creating an unsupportive macroeconomic backdrop for energy equities.
Despite short-term volatility, Equinor's corporate fundamentals and long-term capital allocation plans remain active. The company continues to execute its scheduled share buy-back programme to optimize capital structure and support employee incentive schemes. Additionally, recent strategic announcements emphasizing the expansion of its global liquefied natural gas portfolio demonstrate an ongoing focus on long-term growth across European and Asian markets. While these structural tailwinds provide underlying support, near-term stock performance continues to be heavily influenced by fluctuations in global energy prices.
Technical Analysis of Equinor ASA (EQNR)
Technically, Equinor ASA (EQNR) shows a MACD (12,26,9) value of -0.490, indicating a neutral signal. The RSI at 49.002 suggests neutral condition and the Williams %R at 84.326 suggests oversold condition. Please monitor closely.
Fundamental Analysis of Equinor ASA (EQNR)
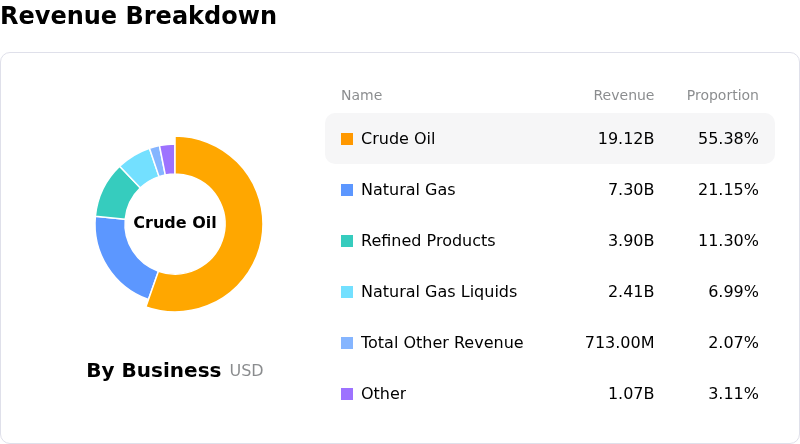
Equinor ASA (EQNR) is in the Energy - Fossil Fuels industry. Its latest annual revenue is $105.83B, ranking 9 in the industry. The net profit is $5.04B, ranking 9 in the industry. Company Profile
Over the past month, multiple analysts have rated the company as Hold, with an average price target of $38.64, a high of $49.00, and a low of $31.25.
More details about Equinor ASA (EQNR)
Company Specific Risks:
- Valuation Compression and Analyst Downgrades: Following a multi-month rally toward 52-week highs, equity analysts including Gerdes Energy Research have downgraded EQNR to Neutral, while intrinsic valuation models estimate the stock to be overvalued by over 26% relative to historical fair value, increasing exposure to institutional profit-taking.
- Regulatory Vulnerability to EU Emergency Energy Policies: As European natural gas prices fluctuate ahead of winter, Equinor faces growing operational risk from prospective European Union political interventions, including potential windfall profit taxes or wholesale gas price caps that could directly impair profit margins.
- Commodity Price Sensitivity and Multiple Risk: Equinor's expanded trailing P/E ratio of 12.0x—elevated compared to its 5-year median of 8.0x—leaves the stock vulnerable to earnings contraction if geopolitical risk premiums dissipate and lower European TTF gas or Brent crude benchmarks.
- Capital Allocation Drag and Transition Execution Risks: Substantial capital outlays toward power infrastructure, including the $940 million acquisition of a majority stake in Pennsylvania's Lackawanna Energy Center, combined with ongoing energy transition expenditures and a 78% Norwegian petroleum tax burden, threaten to weigh on return on capital employed.
Recommended Articles


