


Meta Stock Forecast: Muse Ignites AI Rally, Stock Surges Over 11% in a Day, Poised to Challenge $1,000
TradingKey - As of the close on September 21, Eastern Time, Meta (META) stock surged 11.34% in a single day to close at $741.25, marking its largest single-day gain in over a year and boosting the company's market capitalization by approximately $190 billion in a single day.
Muse's Popularity Bolsters AI Commercialization Expectations as Market Reassesses Meta's Heavy AI Spending
From a fundamental perspective, the core driver behind Meta's stock price surge on Monday was the explosive popularity of Muse. After its launch in September, the AI agent quickly topped the chart of free apps on the Apple App Store in the US. It is capable of completing multi-step tasks such as filling out web forms and shopping, and can be used through a standalone app as well as WhatsApp. Meta also introduced paid subscription plans of $20 and $100 per month, giving Muse a more direct consumer-facing monetization pathway compared to its previous AI investments, which were primarily focused on boosting ad efficiency.
For Meta, Muse's rapid growth has temporarily relieved market concerns over excessively high AI capital expenditures. The company expects its capital expenditures to reach $130 billion to $145 billion in 2026. Meanwhile, Meta's second-quarter revenue reached $60.8 billion, a 28% year-over-year increase, but costs and expenses grew by 55%, with the operating margin falling from 43% in the same period last year to 31%.
As a result, Wells Fargo significantly raised its price target on META from $640 to $796 while maintaining an "Overweight" rating. Moving forward, market focus will shift to the Meta Connect conference on September 23–24, where investors will closely watch whether user growth for Muse, AI models, and new products such as smart glasses can further raise expectations for AI monetization.
However, Muse is still in its early launch phase, and whether initial downloads will translate into sustained paying users remains to be seen. Furthermore, Amazon has restricted Muse from performing certain shopping operations on its platform, illustrating that AI agents still face future challenges regarding platform access, security, and commercial interests.
Meta Stock Technical Analysis
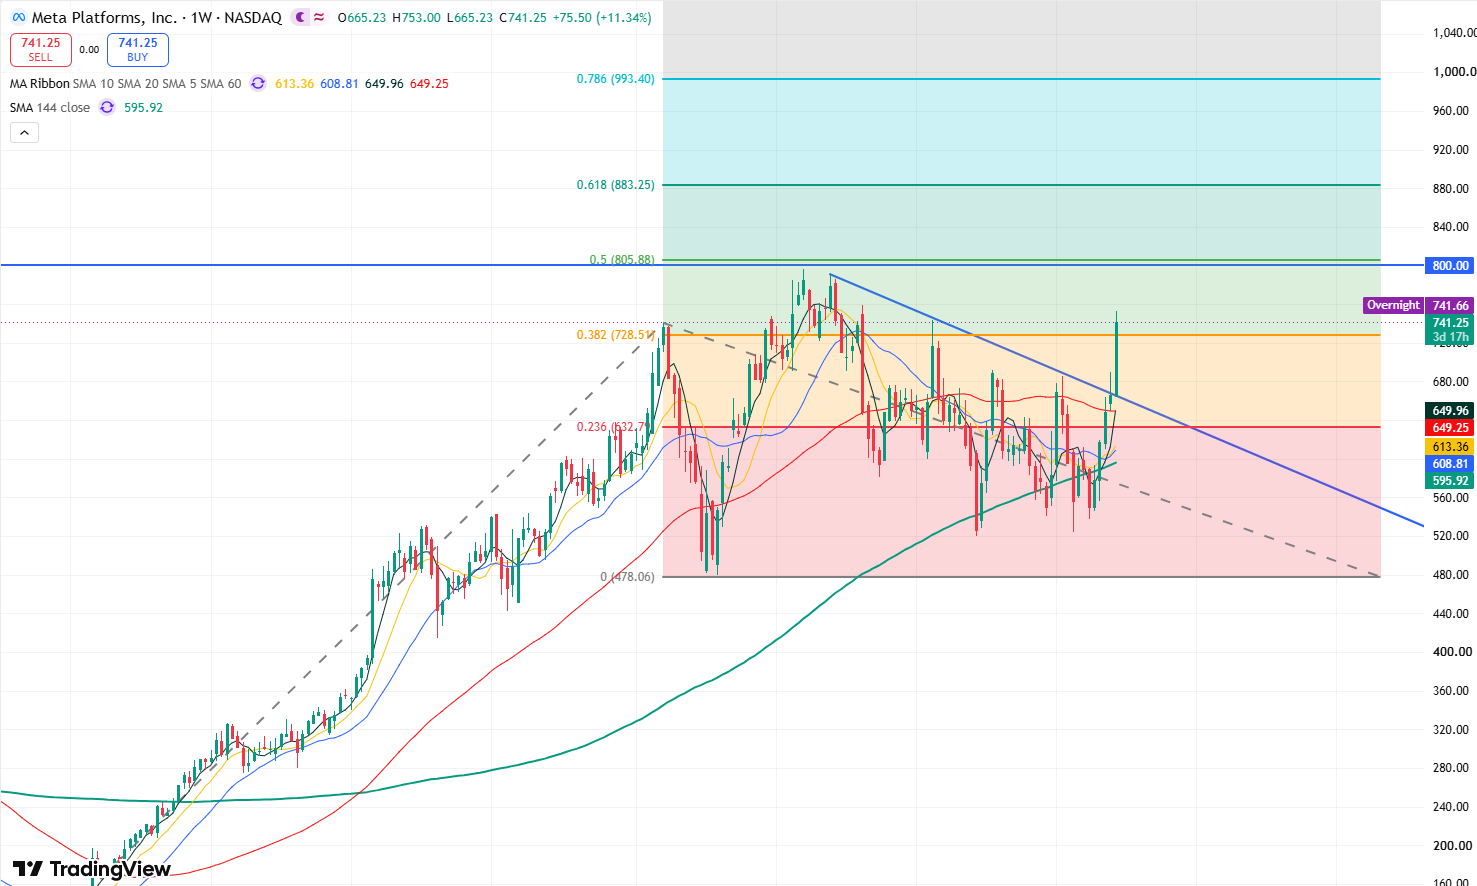
META stock weekly chart, Source: TradingView
According to the weekly chart of META's stock price, following Monday's sharp surge, the downward trendline connecting previous candlestick highs was decisively broken, significantly strengthening market bullish momentum. The stock price may continue its upward trend in the short term.
Currently, the stock price broke through its January rebound high of $744 on Monday, further opening up upside room. The primary upside target will test the $800 mark. If the stock can firmly hold above $800, it will open up room toward the 0.618 Fibonacci extension level ($880), with potential to further challenge the $1,000 mark.
On the downside, initial key support is at $700–$710, serving as crucial psychological support following this breakout. If profit-taking occurs, stronger support can be found at $665–$680, near the platform area prior to the surge.
Recommended Articles


