


Banco Santander SA Stock (SAN) Moved Down by 3.07% on Sep 18: Facts Behind the Movement
Banco Santander SA (SAN) moved down by 3.07%. The Banking & Investment Services sector is down by 0.87%. The company underperformed the industry. Top 3 stocks by turnover in the sector: JPMorgan Chase & Co (JPM) down 0.76%; Goldman Sachs Group Inc (GS) down 1.00%; Bank of America Corp (BAC) down 0.35%.
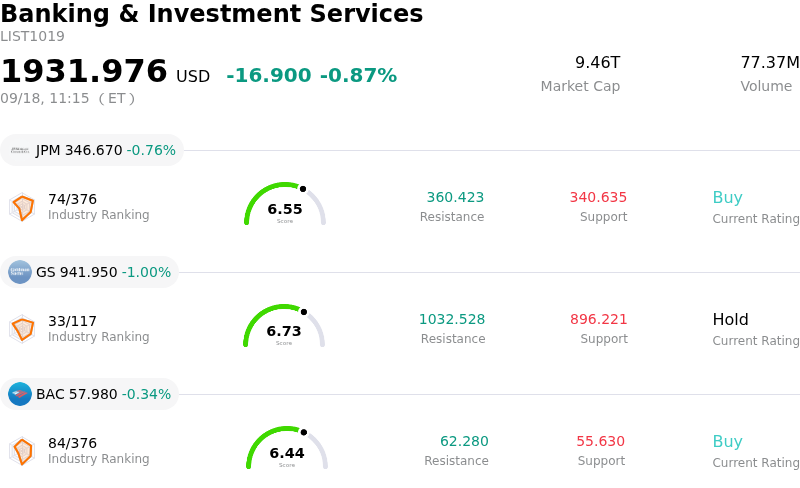
What is driving Banco Santander SA (SAN)’s stock price down today?
Banco Santander experienced notable downward pressure and intraday volatility during trading, driven primarily by a broader retreat across international banking equities. Following a sustained rally that recently pushed the stock near multi-month highs, institutional market participants engaged in profit-taking. This shift in sentiment was exacerbated by renewed fluctuations in global sovereign bond yields and broader market uncertainty surrounding central bank policy paths, which weighed heavily on rate-sensitive financial sector assets.
Company-specific factors and recent analyst commentary also contributed to the negative price momentum. Recent research notes from major financial firms included modest downward revisions to full-year earnings per share forecasts for the bank. Although these adjustments were minor, they served as a catalyst for institutional investors to reassess near-term valuation metrics, particularly given the equity's strong performance earlier in the year. Equity research downgrades and valuation concerns from selected market observers further amplified selling interest among short-term traders.
Furthermore, market participants are closely evaluating the bank's strategic capital allocation against a complex macroeconomic backdrop in key geographic markets. While Banco Santander continues to execute its significant share buyback program to return capital to shareholders, recent announcements regarding major multi-year capital investment plans in regional growth markets have sparked debate over long-term capital efficiency and execution risk. Concerns over potential net interest margin compression in European retail banking and currency volatility in Latin American operations continue to create intraday price instability as investors balance fundamental strengths against near-term macro headwinds.
Technical Analysis of Banco Santander SA (SAN)
Technically, Banco Santander SA (SAN) shows a MACD (12,26,9) value of -0.114, indicating a neutral signal. The RSI at 46.391 suggests neutral condition and the Williams %R at 90.667 suggests oversold condition. Please monitor closely.
Fundamental Analysis of Banco Santander SA (SAN)
Banco Santander SA (SAN) is in the Banking & Investment Services industry. Its latest annual revenue is $65.95B, ranking 5 in the industry. The net profit is $15.90B, ranking 5 in the industry. Company Profile
Over the past month, multiple analysts have rated the company as Buy, with an average price target of $14.71, a high of $15.60, and a low of $13.82.
More details about Banco Santander SA (SAN)
Company Specific Risks:
- Latin American Segment Earnings Downgrades: JPMorgan downgraded Banco Santander Brasil from Overweight to Neutral and slashed its FY2026 and FY2027 earnings forecasts by 13% below consensus. The cut highlights a slower-than-anticipated earnings recovery path and persistent margin pressure across key Latin American operations.
- Consensus EPS Estimate Revisions: Erste Group Bank lowered its full-year EPS forecast for Banco Santander to $1.19, falling below the broader market consensus of $1.25. This downward revision follows recent quarterly results where earnings per share missed consensus estimates, raising doubts about near-term profit growth.
- Institutional Profit-Taking and Valuation Risks: Trading near 52-week highs, Santander faces institutional selling pressure, with funds trimming positions following analyst warnings regarding stretched valuations. Morningstar issued a conservative fair-value assessment well below recent market prices, signaling downside exposure if macroeconomic conditions or rate cuts compress net interest margins.
- M&A Integration and Execution Overhead: The bank faces ongoing execution friction, capital absorption, and potential earnings dilution tied to large-scale international acquisitions and integration efforts, including the Webster Financial deal. Management must execute aggressive efficiency targets amid uncertain regional macro backdrops and foreign exchange volatility.
Recommended Articles


