


Solana (SOLUSD) Is up 1.01% on Sep 17: Here Is Why
Solana (SOLUSD) is up 1.01% at Sep 17 23:30(ET), now at $98.7, with a 7-day down of 0.35%.
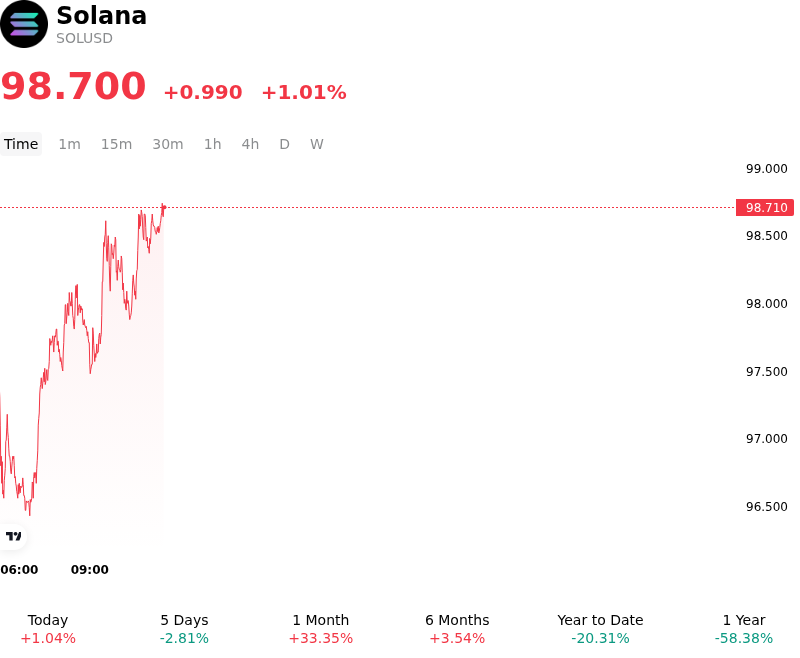
What is driving Solana (SOLUSD)’s stock price up today?
Capital flows into Solana were supported by persistent institutional appetite and steady net inflows into U.S. spot Solana ETF products. The broader institutional narrative around Solana remains reinforced by regulatory clarity regarding listing frameworks, which has placed the asset alongside Bitcoin and Ethereum within standardized exchange trust rules. Continuous institutional accumulation, particularly in staking-enabled spot ETF vehicles, provided a reliable demand floor near critical technical support zones, encouraging market participants to rebuild long positioning.
Macroeconomic factors also contributed to the upward price action as digital asset markets stabilized following the Federal Reserve's monetary policy announcement. Once the anticipated policy outcome was fully absorbed, crypto derivatives markets experienced short-covering and a reset in leverage, allowing spot liquidity to absorb prior selling pressure. The removal of immediate policy uncertainty improved short-term risk sentiment across major Layer-1 tokens, benefiting assets with deep secondary market liquidity.
Ecosystem developments and on-chain fundamentals played a key role in reinforcing investor confidence. Sustained growth in on-chain real-world asset tokenization, expanding volume in synthetic equities, and protocol-level execution updates—including network throughput enhancements and state rent cost reductions—underpinned long-term structural adoption expectations. While institutional investors remain attentive to broader regulatory developments and macroeconomic tightening risks, the combination of spot ETF-driven capital inflows, expanding on-chain activity, and solid technical defense of key support levels facilitated the asset's advance.
Technical Analysis of Solana (SOLUSD)
Technically, Solana (SOLUSD) shows a MACD (12,26,9) value of -2.709, indicating a neutral signal. The RSI at 52.546 suggests neutral condition and the Williams %R at 66.667 suggests sell condition. Please monitor closely.
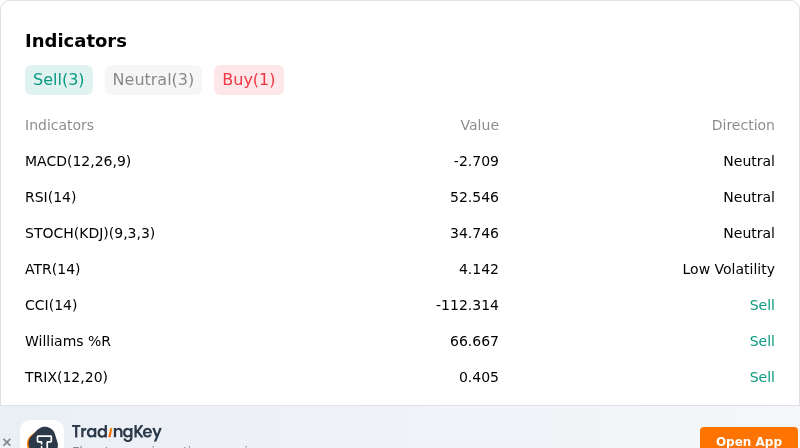
More details about Solana (SOLUSD)
Recent Events and Risks:
- US Senate Regulatory Setback: The failure of the U.S. Senate to advance the CLARITY Act following a stalled procedural vote has injected widespread regulatory uncertainty into crypto markets, triggering market-wide liquidations and driving high-beta assets like SOL below key psychological thresholds.
- ETF Demand Softening: Institutional capital inflows into spot Solana ETF products experienced a drastic decline, tumbling by roughly 96% down to just $6 million in recent sessions and removing the passive structural bid that previously absorbed sell-side liquidity.
- Elevated Derivatives Liquidation Exposure: With SOL breaking below the critical $100 level and testing key technical support near $94.40, heavily one-sided long positioning in perpetual futures markets leaves the token highly vulnerable to accelerated forced sell-offs and leverage unwinds.
- Macro Economic Tightening Pressure: Surging 10-year Treasury yields reaching 5%, elevated crude oil prices, and hawkish expectations surrounding Federal Reserve interest rate policy have sparked a broader risk-off move across speculative digital assets, heavily weighing on SOL.
Recommended Articles


