


Ethereum (ETHUSD) Volatility Intensified on Sep 14: What You Should Know
Ethereum (ETHUSD) is down 1.09% at Sep 14 20:10(ET), now at $2482.88, with a 7-day down of 0.38%.
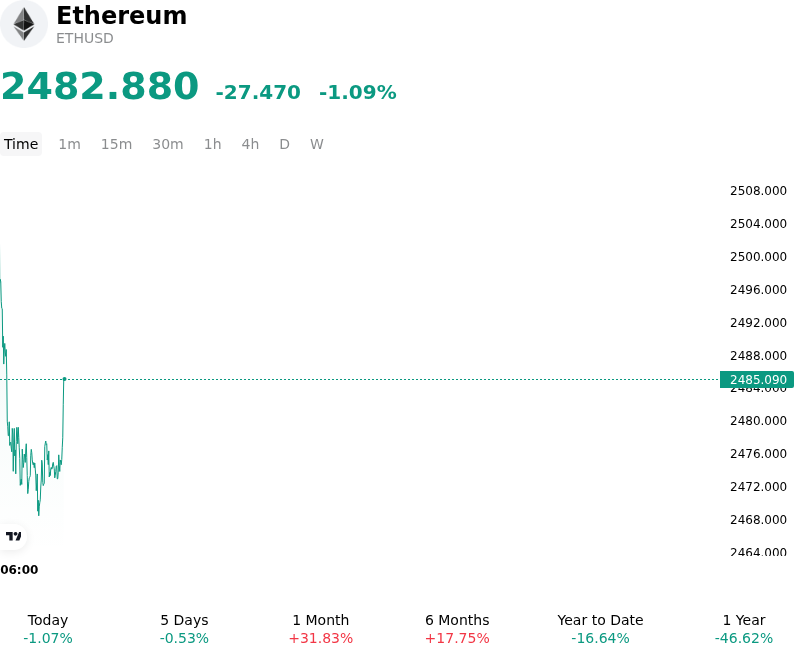
What is driving Ethereum (ETHUSD)’s stock price down today?
Ethereum experienced a modest intraday pullback as institutional market participants engaged in tactical de-risking ahead of upcoming macroeconomic catalysts, most notably the impending Federal Reserve monetary policy decision. With Treasury yields remaining elevated and broader financial markets re-evaluating short-term liquidity conditions, macro-focused investors temporarily reduced exposure to high-beta digital assets. The resulting caution across institutional desks weighed on spot demand, prompting a minor risk-off capital reallocation toward dollar-denominated cash equivalents.
From a market structure perspective, the downside move was exacerbated by technical resistance near recent range high boundaries. Following a sustained multi-week rally that had pushed Ethereum toward key breakout levels, leveraged positioning in the perpetual derivatives market became increasingly stretched. The inability to decisively breach overhead resistance triggered a wave of systematic position trimming and localized long liquidations. As market makers adjusted bid-ask spreads to absorb short-term selling volume, spot prices slipped lower, normalizing funding rates across major crypto derivatives platforms.
Despite the temporary softness in market price, institutional foundations for the asset remain structurally constructive. While intraday spot Ethereum ETF flows saw a brief pause in momentum as asset managers awaited central bank policy direction, cumulative institutional fund inflows over recent weeks continue to absorb exchange liquidity. On-chain metrics highlight resilient baseline network activity, characterized by sustained transaction volume across Layer-2 scaling ecosystems and steady validator staking participation. Consequently, the intraday price decline reflects an event-driven liquidity consolidation and leverage reset rather than a structural shift in medium-term adoption dynamics.
Technical Analysis of Ethereum (ETHUSD)
Technically, Ethereum (ETHUSD) shows a MACD (12,26,9) value of -35.401, indicating a neutral signal. The RSI at 59.469 suggests neutral condition and the Williams %R at 61.257 suggests sell condition. Please monitor closely.
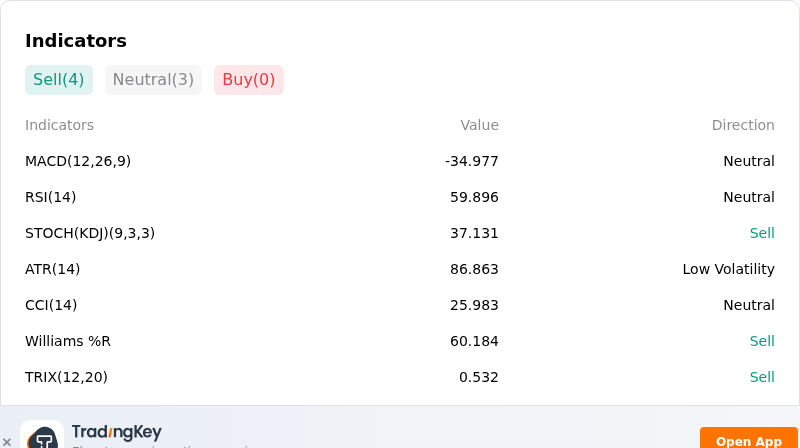
More details about Ethereum (ETHUSD)
Recent Events and Risks:
- Derivatives Over-Leverage and Liquidation Exposure: Derivatives positioning heatmaps indicate concentrated long-side leverage clustered directly below immediate technical support, with market estimates showing over $1.2 billion in long positions vulnerable to forced liquidation cascades if ETH breaches the $2,405 price threshold.
- Macroeconomic Tightening and Yield Pressure: Sticky U.S. inflation metrics combined with rising crude oil prices have pushed 10-year U.S. Treasury yields near 4.9%, driving interest rate-hike expectations ahead of the Federal Reserve's FOMC decision and pressuring high-beta digital asset valuations.
- Regulatory and Legislative Policy Uncertainty: Market sentiment remains constrained as Congress prepares to review digital asset tax proposals and vote on procedural motions for crypto market structure legislation, while regulatory delays around pending ETF filings sustain policy headwinds.
- Exchange Overhead and Large Holder Distribution: Recent on-chain tracking highlights significant whale wallet transfers to centralized exchanges alongside active options market positioning clustered around lower downside strikes ($2,250), exposing thin weekend order books to secondary market spot selling pressure.
Recommended Articles


