


Solana (SOLUSD) Is down 2.17% on Sep 14: What Are the Risk Factors?
Solana (SOLUSD) is down 2.17% at Sep 14 20:00(ET), now at $98.3, with a 7-day down of 4.66%.
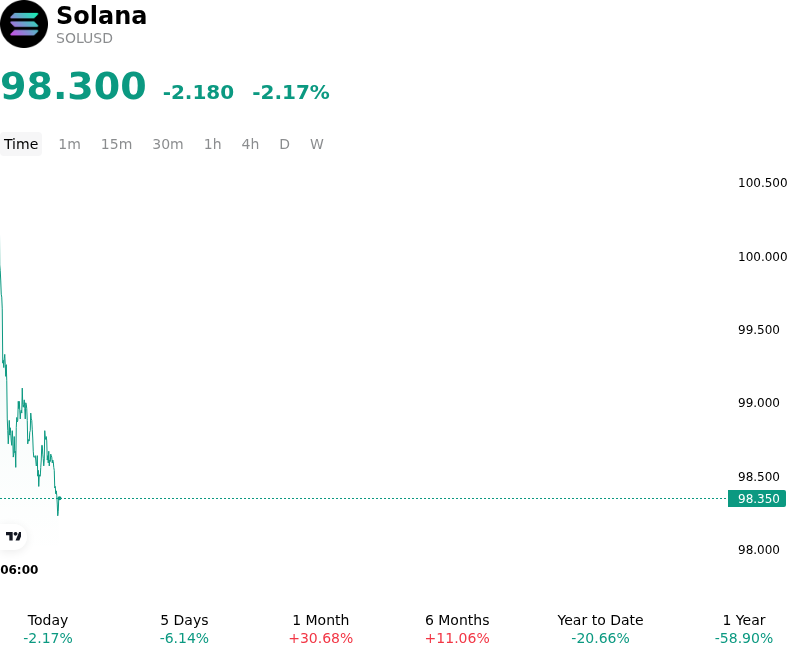
What is driving Solana (SOLUSD)’s stock price down today?
Solana pulled back as broader cryptocurrency markets faced selling pressure driven by macroeconomic caution, cooling spot ETF inflows, and leverage unwinding in the derivatives market. Heading into key central bank policy decisions, macro risk appetite remained constrained as elevated U.S. Treasury yields and persistent inflation concerns led institutional allocators to trim exposure to high-beta digital assets. The broader market risk-off tone created a challenging environment for altcoins, limiting new capital inflows despite solid baseline network fundamentals.
Institutional participation through spot Solana exchange-traded funds showed signs of momentum moderation. After strong inflows earlier in the month following regulatory advancements, daily spot ETF flows stagnated, failing to generate the buying pressure required to clear overhead technical resistance. Without robust institutional spot absorption, spot order books experienced liquidity friction, leaving the asset vulnerable to profit-taking from short-term traders and systematic funds.
Derivatives market dynamics further compounded downward pressure. Cooling futures open interest and a modest wave of long liquidations indicated that leveraged traders chose to de-risk rather than defend near-term support levels. Technical momentum indicators, including short-term bearish divergences on momentum oscillators, encouraged systematic selling as price action faltered near key psychological resistance thresholds.
On-chain metrics continue to demonstrate underlying structural durability, highlighted by sustained decentralized exchange trading volumes, expanding tokenized real-world asset growth, and recent protocol upgrades enhancing network throughput capability. However, broader liquidity conditions and short-term capital flows dominated price action. Market participants continue to monitor global macroeconomic signals, Federal Reserve policy expectations, and spot ETF flow trends as key drivers of Solana's upcoming directional trajectory.
Technical Analysis of Solana (SOLUSD)
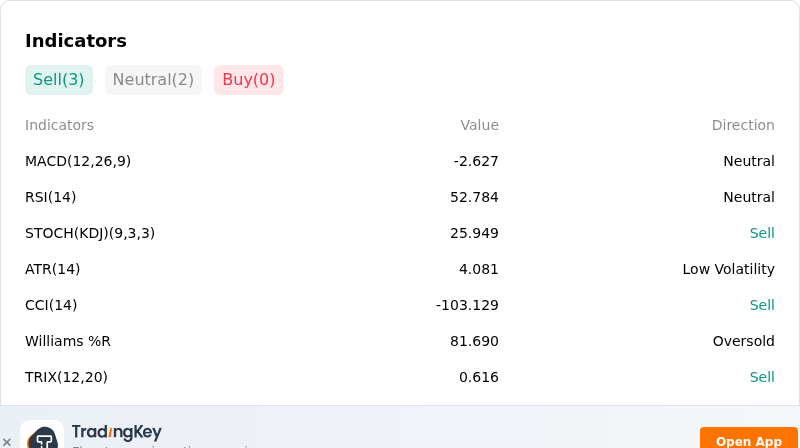
Technically, Solana (SOLUSD) shows a MACD (12,26,9) value of -2.627, indicating a neutral signal. The RSI at 52.784 suggests neutral condition and the Williams %R at 81.690 suggests oversold condition. Please monitor closely.
More details about Solana (SOLUSD)
Recent Events and Risks:
- Derivative Leverage and Long Liquidation Exposure: Solana's breakdown below the key $100 support level has triggered widespread long liquidations across major exchanges, with concentrated leverage clusters remaining vulnerable to cascading stop-outs if price pressure drives a retest of support levels near $93 and $90.
- Institutional Outflows from Solana Funds: Net redemptions recorded in spot Solana exchange-traded funds and structured digital asset products reflect weakening short-term institutional demand, compounding intraday sell-off pressure and dampening market-maker liquidity.
- Macro Risk-Off and Rising Yield Pressures: Broad financial market friction—amplified by US 10-year Treasury yields approaching 5% and surging crude oil prices—has triggered risk-averse capital rotation out of high-beta cryptocurrencies, disproportionately impacting SOL intraday flows.
- On-Chain Liquidity Contraction and Regulatory Scrutiny: On-chain metrics indicate contracting liquidity and elevated realized losses, while lingering regulatory uncertainty around proof-of-stake validator infrastructure and security classification in exchange enforcement actions continues to weigh on trader sentiment.
Recommended Articles


