


ServiceNow Inc Stock (NOW) Moved Down by 5.20% on Sep 8: Facts Behind the Movement
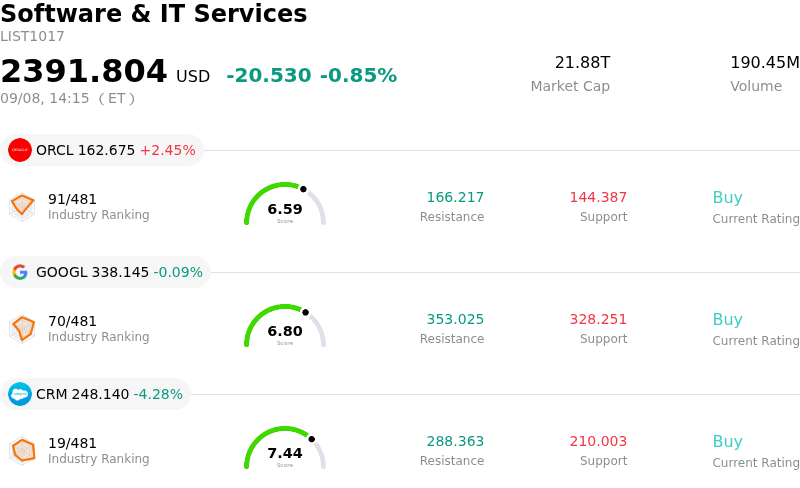
ServiceNow Inc (NOW) moved down by 5.20%. The Software & IT Services sector is down by 0.85%. The company underperformed the industry. Top 3 stocks by turnover in the sector: Oracle Corp (ORCL) up 2.40%; Alphabet Inc Class A (GOOGL) down 0.09%; Salesforce Inc (CRM) down 4.28%.
What is driving ServiceNow Inc (NOW)’s stock price down today?
ServiceNow experienced selling pressure as a broader risk-off environment and firm benchmark Treasury yields weighed on high-valuation enterprise software equities. Following a multi-week run-up driven by peer earnings optimism across the broader software sector, high-multiple software-as-a-service providers encountered profit-taking. Elevated discount rates continue to compress valuation multiples for long-duration growth assets, leaving stocks trading at premium earnings multiples particularly sensitive to market sentiment shifts.
Sector-specific dynamics and evolving artificial intelligence commentary further contributed to the downward momentum. Institutional investors are scrutinizing the potential disintermediation of traditional seat-based licensing models as autonomous enterprise workflow tools advance. Emerging competition from foundational AI providers entering IT service desk management, coupled with higher infrastructure and hosting costs associated with delivering generative AI capabilities, has fueled concerns over medium-term gross margin trajectory and monetization velocity.
Company-specific operational and balance sheet factors also influenced intraday trading. Scrutiny surrounding recent capital allocation decisions remains top of mind following the substantial debt issuance to fund strategic acquisitions. The shift from a net-cash position to increased leverage has temporarily paused share buybacks and increased interest obligations, coinciding with management guidance pointing toward elevated AI infrastructure expenditures. When paired with recent disclosures of insider share sales, institutional investors opted to reduce exposure, accelerating the pullback.
Technical Analysis of ServiceNow Inc (NOW)
Technically, ServiceNow Inc (NOW) shows a MACD (12,26,9) value of -0.181, indicating a neutral signal. The RSI at 54.002 suggests neutral condition and the Williams %R at 50.404 suggests neutral condition. Please monitor closely.
Media Coverage of ServiceNow Inc (NOW)
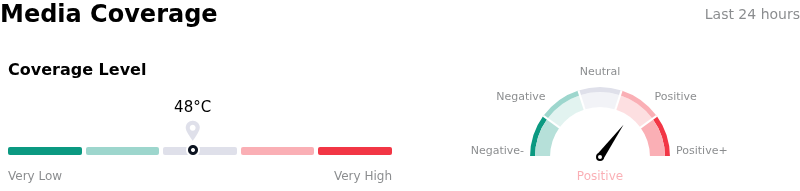
In terms of media coverage, ServiceNow Inc (NOW) shows a coverage score of 48, indicating a moderate level of media attention. The overall market sentiment index is currently in bullish zone.
Fundamental Analysis of ServiceNow Inc (NOW)
ServiceNow Inc (NOW) is in the Software & IT Services industry. Its latest annual revenue is $13.28B, ranking 28 in the industry. The net profit is $1.75B, ranking 30 in the industry. Company Profile
Over the past month, multiple analysts have rated the company as Buy, with an average price target of $145.89, a high of $248.00, and a low of $72.00.
More details about ServiceNow Inc (NOW)
Company Specific Risks:
- Valuation Multiples and Profit-Taking Volatility: Elevated valuation metrics, including a trailing P/E ratio near 90x, leave the stock highly vulnerable to sudden sell-offs and institutional profit-taking if subscription growth fails to outpace elevated expectations.
- Margin Pressures from AI Spending and M&A Integration: Substantial capital outlays required for generative AI infrastructure and the integration of large strategic acquisitions are pressuring non-GAAP operating and free cash flow margins.
- IT Budget Reallocation Risks: Enterprise clients shifting discretionary IT budgets toward foundational generative AI hardware and infrastructure pose a threat to non-AI workflow software upgrades and seat expansion.
- Insider Sales Impacting Market Sentiment: Sustained insider net selling exceeding $6 million has weighed on market sentiment, compounding overhead technical resistance following recent price advances.
Recommended Articles


