


USD/JPY (USDJPY) Is down 0.65% on Sep 8: Are Market Expectations Adjusting?
USD/JPY (USDJPY) is down 0.65% at Sep 8 00:00(ET), now at $153.328, with a 7-day down of 4.26%.
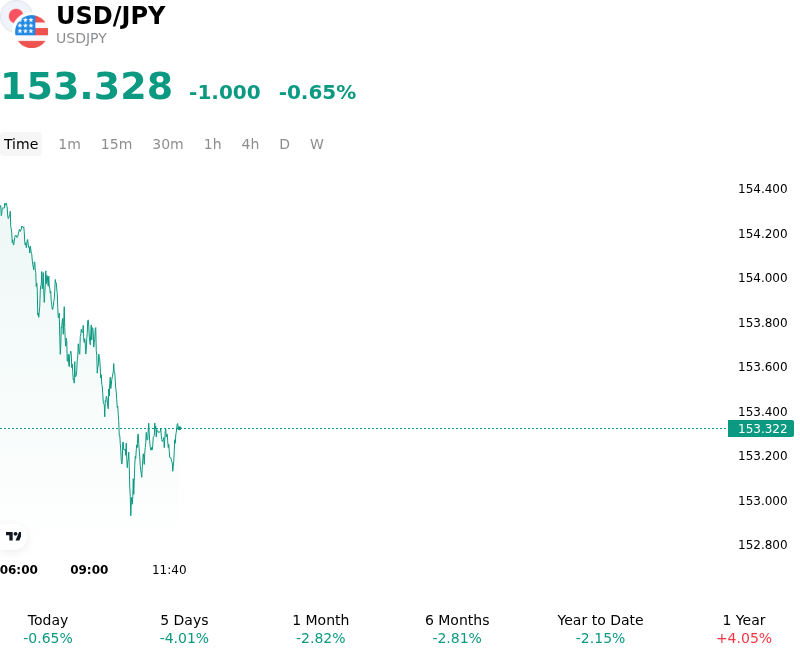
What is driving USD/JPY (USDJPY)’s stock price down today?
The downward momentum in USDJPY was primarily driven by a sharp repricing of Bank of Japan policy expectations alongside a broad unwinding of speculative yen short positions. Financial markets aggressively discounted an impending quarter-point rate hike at the upcoming Bank of Japan monetary policy meeting, bolstered by increasingly hawkish communications from central bank officials and government advisers. The heightened probability of monetary tightening pushed Japanese benchmark yields higher, with the ten-year Japanese government bond yield reaching multi-decade highs. This upward shift in domestic yields narrowed the interest-rate differential between the United States and Japan, significantly diminishing the risk-adjusted return of holding short-yen carry trade structures and spurring widespread position adjustments.
On the other side of the pair, the U.S. dollar experienced consolidation as market participants adjusted positioning ahead of critical upcoming U.S. inflation data. Although solid U.S. economic and employment indicators maintained debate over the Federal Reserve's rate path, the greenback failed to sustain momentum against the yen. Technical breakdowns below key psychological and chart support levels accelerated the pair's decline, as automated flows and institutional stop-loss execution forced leveraged funds to trim dollar exposure. The structural shift toward policy convergence between the Federal Reserve and the Bank of Japan continued to incentivize asset managers to reduce dollar overweights in favor of the appreciating yen.
This market adjustment appears supported by a broader macro trend rather than a transient, headline-driven move. The structural transition in Japanese monetary policy, supported by firm domestic wage gains and persistent price pressures, provides fundamental backing for sustained yen revaluation. Nevertheless, institutional investors continue to monitor key risks that could trigger short-term volatility. These include the upcoming U.S. consumer price index release, potential geopolitical headlines in energy markets, and the possibility that unexpected central bank messaging or shifts in global risk sentiment could temporarily disrupt the current pace of yield-differential compression.
Technical Analysis of USD/JPY (USDJPY)
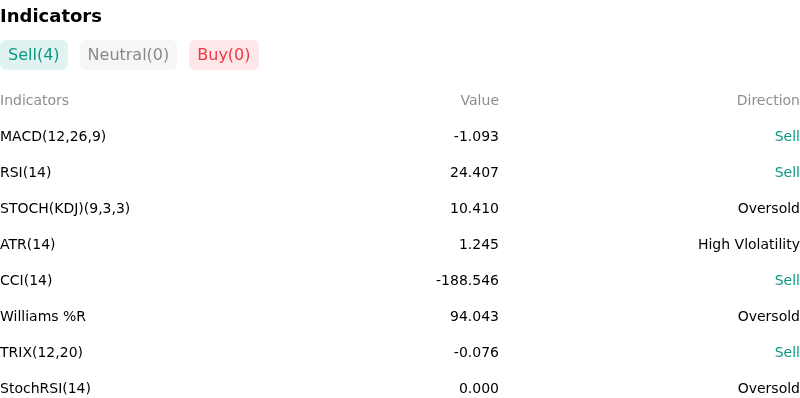
Technically, USD/JPY (USDJPY) shows a MACD (12,26,9) value of -1.093, indicating a sell signal. The RSI at 24.407 suggests sell condition and the Williams %R at 94.043 suggests oversold condition. Please monitor closely.
More details about USD/JPY (USDJPY)
Recent Events and Risks:
- Hawkish Bank of Japan Policy Repricing: Aggressive signals from Bank of Japan policymakers, including Board Member Hajime Takata floating larger or consecutive rate increases and government advisers supporting near-term tightening, have led markets to near-fully price in a 25-basis-point rate hike to 1.25%, driving short-term JGB yields higher and putting strong downside pressure on USD/JPY.
- Yen-Funded Carry Trade Unwind Risk: The rapid narrowing of the US-Japan interest rate differential has accelerated short-covering across yen-funded carry positions, with a potential technical break below the critical 155.00 support level threatening to trigger cascading stop-loss liquidations and sharp intraday declines.
- Dovish Federal Reserve Rate Expectations: US Dollar upside remains capped following dovish commentary from Federal Reserve Governor Christopher Waller and elevated trader positioning ahead of upcoming US inflation reports, leaving USD/JPY exposed to asymmetric downside volatility if US economic data releases disappoint.
- Covert FX Intervention Threats: Persistent market anxiety over potential unannounced currency intervention or rate checks by Japan's Ministry of Finance—especially following USD/JPY's recent rejection from key resistance near 158.00–160.00—continues to encourage short positioning and restrict upward market momentum.
Recommended Articles


