


Sugar (SUGAR) Volatility Intensified on Sep 4: What to Watch
Sugar (SUGAR) is up 2.15% at Sep 4 06:25(ET), now at $0.1901, with a 7-day up of 4.97%.
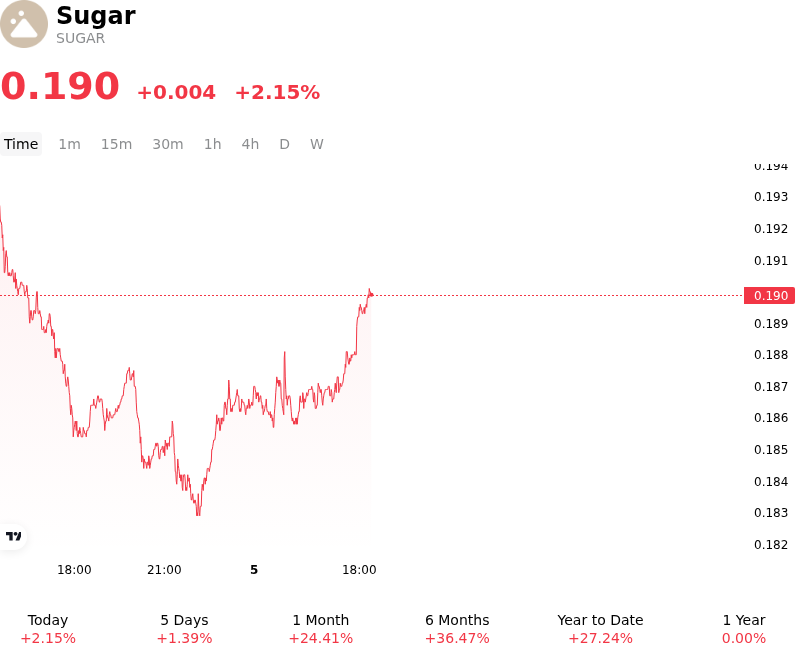
What is driving Sugar (SUGAR)’s stock price up today?
The upward price action in sugar futures was primarily driven by intensifying concerns over global supply deficits and tightening export availabilities across major producing nations. Market participants digested updated forecasts from leading commodity consultancies and international agencies pointing to a shifting global supply-demand balance for the 2026/27 crop year, moving from an anticipated surplus into a structural deficit. In Brazil's key Center-South region, dry weather conditions and a higher allocation of sugarcane toward ethanol processing reduced raw sugar crushing volumes and export availability. Meanwhile, below-normal monsoon performance in India and Thailand exacerbated crop anxieties, leading to expectations of reduced sugarcane yields across South and Southeast Asia.
Exacerbating the supply stringency are trade restrictions and domestic intervention policies in key Asian origins. India's prolonged restrictions on sugar exports and government measures to prioritize domestic stockpiles have effectively removed significant seaborne volumes from the global market, forcing refiners and international buyers to rely heavily on Brazilian origins. Concurrently, weather-driven crop downgrades in the European Union have further limited regional sugar supply. On the demand side, global consumption continues to show resilience, creating a fundamental imbalance that reinforces upward pricing pressure across both raw and white sugar benchmark contracts.
From a market structure perspective, the bullish shift in fundamental balances prompted aggressive speculative short covering and fresh long positioning by institutional funds. Strong capital inflows into front-month contracts accelerated intraday gains, pushing prices toward multi-month highs. While elevated sugar prices may eventually incentivize higher plantings or encourage Brazilian millers to shift back toward sugar production if ethanol margins retreat, the immediate market outlook remains supported by tight physical availability and lingering climate risks. Institutional investors continue to closely monitor weather patterns in the Southern Hemisphere and potential adjustments to Asian export policies for directional cues.
Technical Analysis of Sugar (SUGAR)
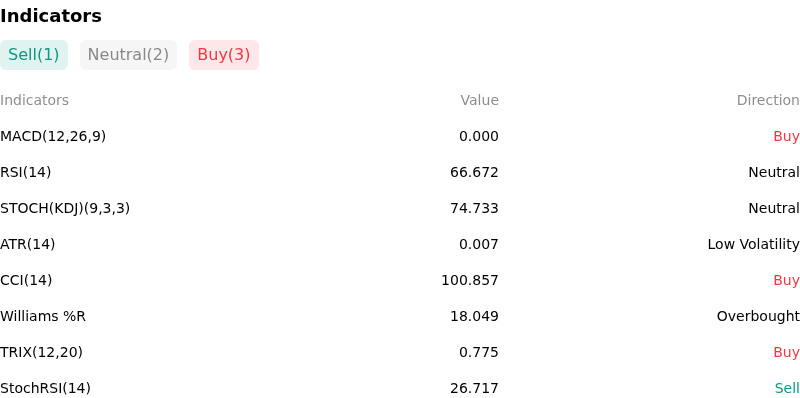
Technically, Sugar (SUGAR) shows a MACD (12,26,9) value of 0.000, indicating a buy signal. The RSI at 66.672 suggests neutral condition and the Williams %R at 18.049 suggests overbought condition. Please monitor closely.
More details about Sugar (SUGAR)
Recent Events and Risks:
- Indian Government Stock Capping and Demand Suppression: The Indian government reduced sugar dealer stock holding limits from 400 MT to 200 MT and mandated immediate domestic inventory releases to cool prices ahead of the festive season. Speculation that these domestic regulatory interventions will force stockpiles onto the market and eliminate India's near-term need for sugar imports triggered sharp long liquidation and intraday selling in global futures.
- Speculative Overextension and Long Liquidation Pressure: Managed money net-long positions expanded to multi-year highs in NY raw sugar futures and record levels in ICE London white sugar. Following a rapid 30% rally to 16-month peaks, overbought momentum indicators and technical rejection at key resistance levels are sparking aggressive profit-taking, leaving market structure vulnerable to forced liquidations if key support levels break.
- Center-South Brazil Crushing Acceleration and Sucrose Recovery: Forecasted rainfall in key Brazilian growing areas like Ribeirão Preto is moderating, enabling Center-South sugar mills to resume rapid harvesting operations. Improving sugarcane sucrose (ATR) content and accelerating crushing momentum are bolstering near-term physical export availability at ports, alleviating spot availability concerns in global supply chains.
- Smaller-Than-Expected Global Deficit Projections: The International Sugar Organization's latest projection of a modest 200,000 metric ton global sugar deficit for 2026/27 fell below market expectations, as robust Brazilian output offsets production declines in other regions. Furthermore, any potential softening in Brazilian domestic ethanol pricing relative to raw sugar export benchmarks risks incentivizing millers to maximize sugar production over biofuels, threatening to release additional physical volume into international markets.
Recommended Articles


