


Bitcoin (BTCUSD) Is up 1.07% on Aug 29: Why It Happened
Bitcoin (BTCUSD) is up 1.07% at Aug 29 14:50(ET), now at $78208.37, with a 7-day up of 1.20%.
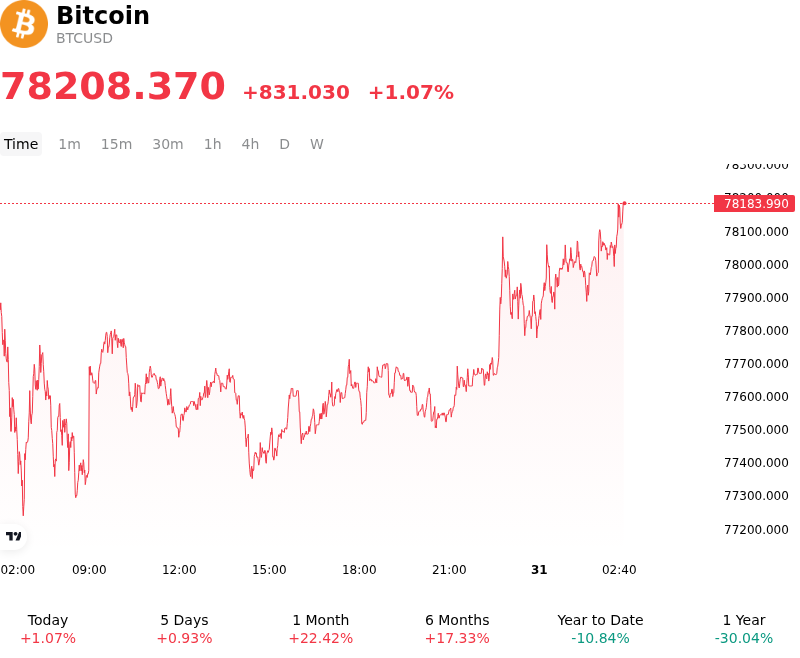
What is driving Bitcoin (BTCUSD)’s stock price up today?
Capital flowed into Bitcoin as persistent spot ETF net inflows and macro liquidity dynamics provided underlying support for digital assets. Institutional investors continued to execute currency-debasement hedging strategies amid ongoing concerns surrounding expanding sovereign debt levels and Treasury market liquidity conditions. Despite hawkish monetary policy commentary that temporarily heightened interest rate sensitivity, steady capital commitments into spot Bitcoin ETF products absorbed sell-side pressure and re-established positive price momentum.
On-chain metrics indicated strategic accumulation by institutional entities and long-term holders around established support zones, stabilizing the broader market structure. In crypto derivatives markets, a subtle shift toward short-covering alongside healthy futures open interest provided key mechanical tailwinds, allowing spot buying to clear overhead liquidity. Additionally, market sentiment benefited from incremental regulatory clarity, particularly as U.S. regulators advanced updated custody rules for investment advisers, further lowering structural barriers to entry for institutional asset managers.
Looking ahead, market participants remain focused on global liquidity trends, Federal Reserve interest rate expectations, and real Treasury yield movements as primary catalysts for medium-term price action. While consistent ETF inflows and corporate treasury adoption continue to validate Bitcoin's store-of-value narrative, digital asset performance over the near term will remain sensitive to macroeconomic risk sentiment and shifts in global monetary conditions.
Technical Analysis of Bitcoin (BTCUSD)
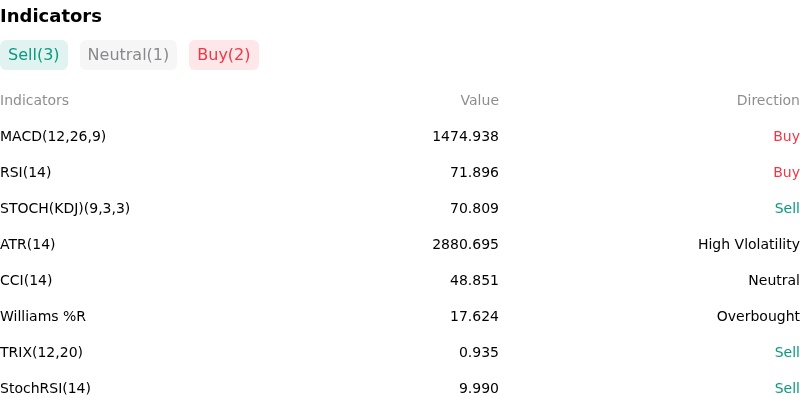
Technically, Bitcoin (BTCUSD) shows a MACD (12,26,9) value of 1474.938, indicating a buy signal. The RSI at 71.896 suggests buy condition and the Williams %R at 17.624 suggests overbought condition. Please monitor closely.
More details about Bitcoin (BTCUSD)
Recent Events and Risks:
- Spot ETF Capital Outflows: U.S. spot Bitcoin ETFs registered over $201 million in net daily redemptions, ending a nine-day, $3 billion inflow streak. Outflows led by ARK 21Shares' ARKB ($114.9M) and Bitwise's BITB ($49.7M) pushed total fund assets below the $100 billion threshold, sharply eroding institutional buy-side market depth.
- Hawkish Federal Reserve Monetary Policy Guidance: Hawkish signals at the Jackson Hole symposium emphasizing persistent inflation concerns sparked a macro repricing, elevating interest rate hike expectations and triggering a cross-asset risk-off retreat that drove BTCUSD down from its weekly high near $81,300 to below $78,000.
- Derivatives Deleveraging and Downside Options Skew: Sudden intraday price weakness accelerated a derivatives deleveraging cascade that wiped out nearly $488 million in leveraged positions, while the BTC 25 Delta Skew spiked into positive territory, signaling aggressive institutional demand for downside put option protection and heightened vulnerability if the $76,500 support level gives way.
- Long-Term Holder Distribution and Weakening On-Chain Momentum: On-chain data indicates active distribution and wallet transfers by long-term holders taking profit near $80,000, while the Chaikin Money Flow metric flipped negative to -0.14, demonstrating that sell-side overhead pressure is currently outstripping spot accumulation.
Recommended Articles


