


Ethereum (ETHUSD) Is up 1.04% on Aug 29: Why It Happened
Ethereum (ETHUSD) is up 1.04% at Aug 29 12:50(ET), now at $2450.28, with a 7-day up of 0.86%.
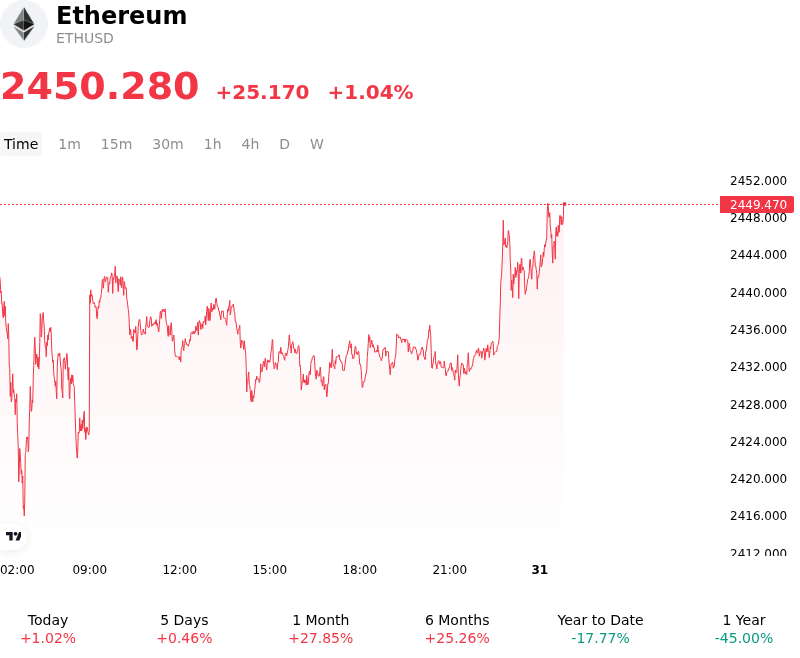
What is driving Ethereum (ETHUSD)’s stock price up today?
Capital flowed into Ethereum as sustained institutional demand through U.S. spot Ethereum ETFs provided continuous buy-side support, stabilizing market structure following a period of short-term technical consolidation. Recent flow metrics demonstrate persistent net inflows into spot Ethereum products, driven primarily by major asset management vehicles. This institutional participation helped absorb localized profit-taking and strengthened investor confidence in Ethereum's expanding role within diversified digital-asset portfolios.
From a market structure and derivatives standpoint, Ethereum's successful defense of key support levels near the critical $2,400 technical pivot encouraged risk appetite and prompted selective short covering across futures markets. Derivatives positioning showed a shift toward constructive bias as funding rates stabilized, allowing spot accumulation to drive price discovery without excessive speculative leverage. On-chain metrics bolstered sentiment further, with consistent decentralized exchange volume and growing adoption of Layer-2 scaling ecosystems highlighting persistent protocol utility.
Macroeconomic conditions provided an additional tailwind as broader market expectations regarding Federal Reserve policy maintained a focus on eventual liquidity easing. A relatively stable Treasury yield environment and soft U.S. dollar trends created a favorable macro backdrop for risk-sensitive assets, enabling digital asset allocations to resume. The upward move illustrates a broader structural trend supported by institutional vehicle inflows and network fundamentals rather than an isolated, event-driven liquidity spike.
Institutional investors remain focused on several key risks. These include the concentration of ETF inflows among a limited number of fund issuers, relatively subdued spot exchange trading volumes, potential interest rate volatility from shifting macroeconomic signals, and evolving regulatory clarity regarding staking yield products and decentralized finance infrastructure.
Technical Analysis of Ethereum (ETHUSD)
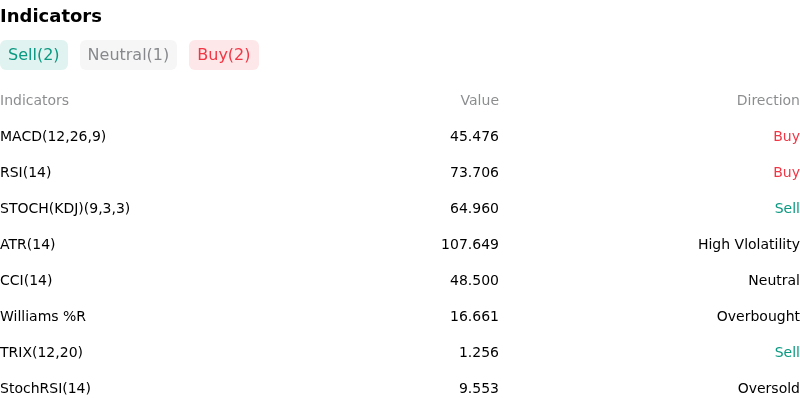
Technically, Ethereum (ETHUSD) shows a MACD (12,26,9) value of 45.476, indicating a buy signal. The RSI at 73.706 suggests buy condition and the Williams %R at 16.661 suggests overbought condition. Please monitor closely.
More details about Ethereum (ETHUSD)
Recent Events and Risks:
- Federal Reserve Hawkish Shift and Macro Risk-Off: Rejection from recent multi-week highs was triggered by hawkish monetary policy signals from Federal Reserve officials and elevated inflation data, driving up Treasury yields, suppressing broader risk-on sentiment, and pressuring digital asset valuations.
- Derivatives Unwinding and Liquidation Cascades: Rejection near the $2,520–$2,550 resistance range following overbought daily technical conditions ignited over $267 million in leveraged position liquidations across crypto derivatives markets, exposing lower technical support levels near $2,400.
- Whale Exchange Inflows and Spot Selling Pressure: On-chain data over the last 72 hours highlighted large transfers from long-term whale wallets and multi-year holders depositing thousands of ETH into centralized exchanges to realize gains, creating localized supply overhang and spot sell pressure.
- DeFi Protocol Exploits and Regulatory Pressures: Security breaches and vault exploits on Ethereum-native DeFi protocols, combined with renewed SEC scrutiny regarding decentralized vault compliance, have elevated operational and regulatory risks across the ecosystem.
Recommended Articles


