


XRP (XRPUSD) Volatility Intensified on Aug 29: What You Should Know
XRP (XRPUSD) is up 1.23% at Aug 29 10:50(ET), now at $1.397, with a 7-day down of 6.97%.
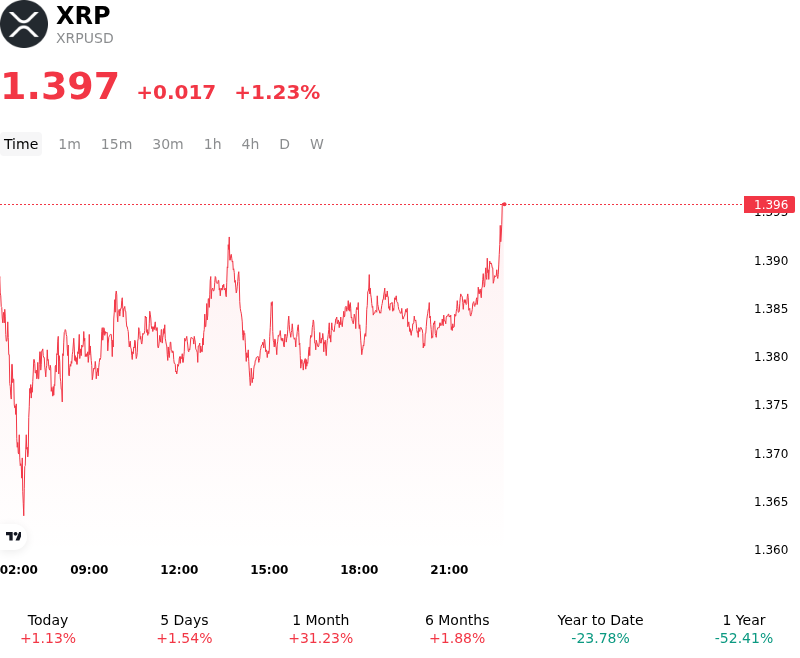
What is driving XRP (XRPUSD)’s stock price up today?
Institutional capital inflows and sustained demand through U.S. spot XRP exchange-traded funds served as the primary catalyst behind the asset's positive price momentum. Despite macroeconomic headwinds stemming from elevated U.S. Treasury yields and a firm U.S. dollar following hawkish Federal Reserve messaging at the Jackson Hole Economic Symposium, institutional buyers provided consistent downside absorption. Continued net daily inflows into spot products—which recently propelled cumulative asset management totals past key historical benchmarks—offset macro-driven risk aversion across the broader digital asset space, allowing the token to defend critical technical support zones and attract renewed bid volume.
Corporate treasury activity and expanding native ecosystem utility significantly reinforced institutional sentiment. Regulatory milestones for corporate vehicle structures, highlighted by the SEC's effective filing status for Evernorth's proposed Nasdaq-listed XRP treasury vehicle, have established a corporate accumulation framework similar to established institutional treasury models. Concurrently, the rapid scaling of Ripple's USD-pegged stablecoin, RLUSD, which surpassed two billion dollars in total market capitalization with nearly half issued directly on the XRP Ledger, provided a structural boost to network liquidity and decentralized finance application prospects, elevating long-term fundamental valuation metrics.
Derivatives market positioning also contributed to a healthier market structure, as leverage was reduced following earlier liquidation cycles. Funding rates across major derivatives venues reset toward neutral levels, indicating that recent upside price action was largely driven by spot market accumulation rather than over-leveraged speculative positioning.
Looking forward, institutional market participants remain focused on key macro and legal developments. Regulatory clarity continues to serve as a pivotal macro driver, with traders assessing legislative progress surrounding U.S. market structure bills such as the CLARITY Act alongside scheduled monthly escrow supply releases. While broader monetary policy dynamics remain a source of short-term volatility, the combination of record spot ETF volume, corporate treasury adoption, and expanding on-chain stablecoin liquidity suggests current capital flows reflect an ongoing structural repricing supported by institutional participation.
Technical Analysis of XRP (XRPUSD)
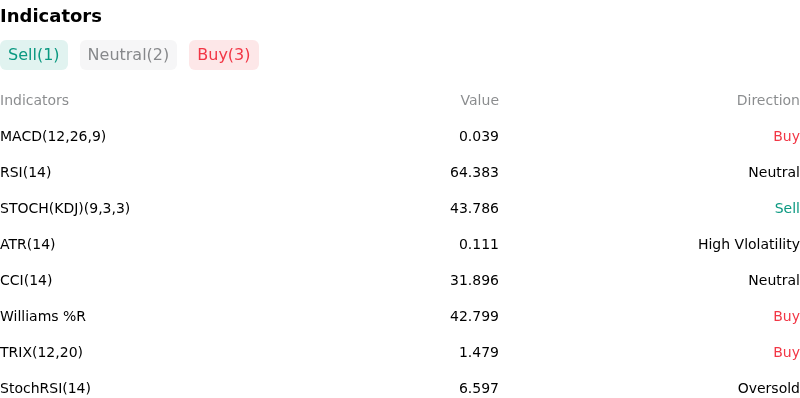
Technically, XRP (XRPUSD) shows a MACD (12,26,9) value of 0.039, indicating a buy signal. The RSI at 64.383 suggests neutral condition and the Williams %R at 42.799 suggests buy condition. Please monitor closely.
More details about XRP (XRPUSD)
Recent Events and Risks:
- Record Derivatives Selling Pressure and Long Liquidations: Aggressive short positioning and heavy derivatives selling on major exchanges have created strong downside momentum, with Binance net taker volume plunging to -$96 million—its steepest sell-side imbalance of 2026—forcing long liquidations and threatening further leverage squeezes.
- Hawkish Federal Reserve Commentary and Macro Headwinds: Hawkish monetary policy signals from Federal Reserve leadership regarding persistent inflation have triggered a broader risk-off pullback across digital assets, dampening speculative market liquidity and pushing XRP down toward key lower support levels.
- Technical Support Breakdown Below Key Value Levels: XRP broke below its $1.43 previous quarter value area high, converting the prior key support into immediate technical resistance and exposing the market to an extended breakdown toward the $1.30–$1.35 price floor.
- Escrow Supply Overhang Concerns and Moderating ETF Inflows: Market sentiment is constrained by SEC filing disclosures suggesting potential supplementary XRP releases from Ripple's escrow beyond standard monthly schedules, while institutional spot ETF net inflows have begun decelerating after hitting local peaks.
Recommended Articles


