


USD/MXN (USDMXN) Is up 0.52% on Aug 28: Are Market Expectations Adjusting?
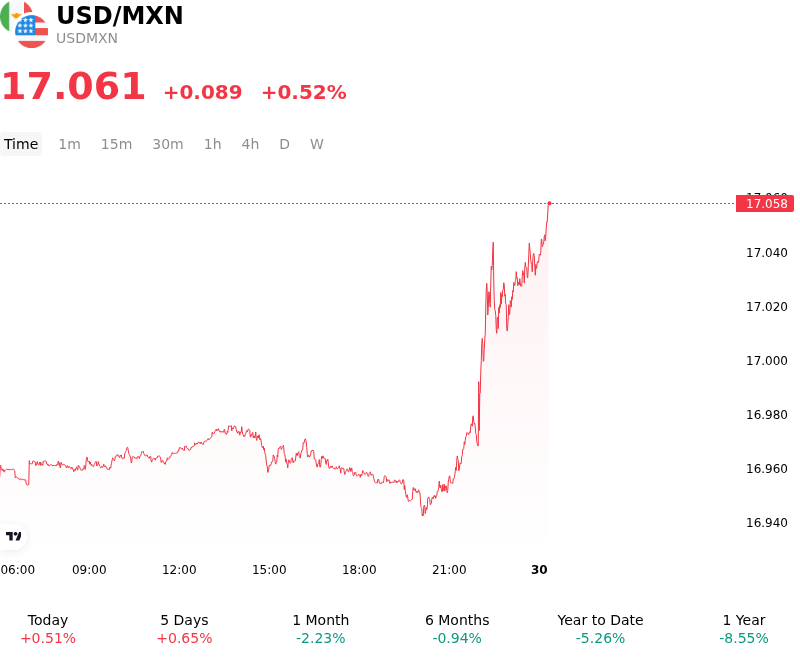
USD/MXN (USDMXN) is up 0.52% at Aug 28 12:20(ET), now at $17.06061, with a 7-day up of 0.85%.
What is driving USD/MXN (USDMXN)’s stock price up today?
The advance in USD/MXN was primarily driven by a broader resurgence in the U.S. dollar, triggered by hawkish communications from Federal Reserve officials at the Jackson Hole Economic Symposium alongside sticky U.S. inflation metrics. Federal Reserve leadership delivered a firm commitment to the central bank’s price stability mandate, highlighting that inflation measured by the Personal Consumption Expenditures price index remains elevated above the official target. By explicitly dampening expectations for near-term monetary easing and emphasizing data dependency with a potential bias toward maintaining restrictive policy, the Fed prompted a hawkish repricing in U.S. interest rate expectations and pushed Treasury yields higher.
The repricing of U.S. interest rate expectations widened yield differentials in favor of the greenback, diminishing the relative attractiveness of the high-yielding Mexican peso. Although the Bank of Mexico has maintained a restrictive policy stance to combat domestic price pressures and recently reiterated a extended timeline for inflation convergence, the shifting rate trajectory in the United States narrowed the net carry-trade advantage that had previously anchored long-peso positions.
Broader market risk sentiment also weighed on the peso. The prospect of sustained elevated borrowing costs in the United States dampened risk appetite across global asset classes, prompting institutional investors to reduce exposure to emerging market currencies in favor of defensive U.S. dollar holdings.
Today's price action appears largely event-driven, reflecting immediate adjustments to Federal Reserve policy guidance and global risk repricing. However, the currency pair remains sensitive to upcoming economic releases and broader trade considerations. Investors will continue to track incoming U.S. inflation data, Treasury bond yield trajectories, and Banxico’s subsequent policy responses to evaluate whether the dollar’s gains represent a brief tactical re-adjustment or the start of a broader structural move in USD/MXN.
Technical Analysis of USD/MXN (USDMXN)
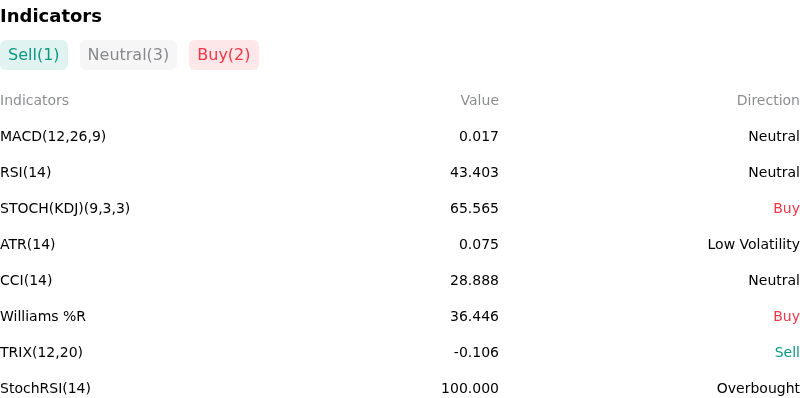
Technically, USD/MXN (USDMXN) shows a MACD (12,26,9) value of 0.017, indicating a neutral signal. The RSI at 43.403 suggests neutral condition and the Williams %R at 36.446 suggests buy condition. Please monitor closely.
More details about USD/MXN (USDMXN)
Recent Events and Risks:
- Hawkish Fed Expectations and Resilient US Data: Recent US economic releases, including lower-than-expected weekly jobless claims (203K vs. 208K expected), alongside hawkish comments from Federal Reserve officials, have reinforced labor market resilience, creating upside volatility risk for USDMXN if U.S. yields continue to rebound.
- Overextended Carry Positioning and Unwind Risk: Net-long Mexican Peso positioning among institutional traders reached multi-month highs above 83,700 contracts, leaving USDMXN exposed to sharp, rapid upside spikes if sudden risk-off sentiment or profit-taking triggers a carry trade unwind.
- Slowing Mexican Inflation and Easing Banxico Stance: Mexican core inflation decelerated to 3.93%, easing domestic price pressures and boosting speculation of future Banxico policy easing, which threatens to narrow the current ~275–300 bps rate differential and undermine Peso support.
- Geopolitical Friction and Global Risk Sentiment: Lingering Middle East geopolitical uncertainty and global energy market volatility continue to pose downside risk to risk-sensitive emerging market assets, leaving USDMXN susceptible to flight-to-safety flows favoring the U.S. Dollar.
Recommended Articles


