


Applied Materials Inc Stock (AMAT) Moved Down by 3.59% on Aug 28: Drivers Behind the Movement
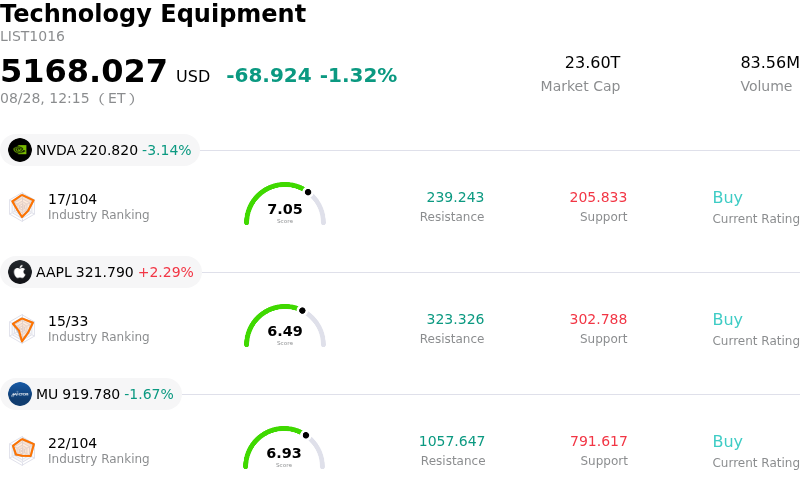
Applied Materials Inc (AMAT) moved down by 3.59%. The Technology Equipment sector is down by 1.32%. The company underperformed the industry. Top 3 stocks by turnover in the sector: NVIDIA Corp (NVDA) down 3.14%; Apple Inc (AAPL) up 2.15%; Micron Technology Inc (MU) down 1.75%.
What is driving Applied Materials Inc (AMAT)’s stock price down today?
Applied Materials experienced downward price momentum driven by broader profit-taking across the semiconductor equipment sector and digestional volatility following its recent fiscal third-quarter earnings release. Although the company recently delivered top- and bottom-line beats alongside robust revenue guidance for the upcoming quarter, market participants remain hyper-focused on margin trajectory and valuation sustainability. With semiconductor equipment stocks trading at elevated multiples after an extended artificial intelligence-driven rally, minor operational friction points have prompted institutional investors to trim exposure.
A primary catalyst weighing on investor sentiment is the near-term margin outlook despite aggressive top-line expansion. As Applied Materials ramps up manufacturing capacity and expands its technical support workforce to satisfy surging demand across gate-all-around architecture, high-bandwidth memory, and advanced packaging, upfront operational expenditures are temporarily constraining gross margin expansion. While underlying system demand remains exceptionally strong, flat quarter-over-quarter gross margin expectations have raised concerns regarding operating leverage efficiency during high-capex investment cycles.
Compounding the downward pressure are ongoing uncertainties surrounding trade restrictions and regulatory risks in China, historically a key geographic market for wafer fab equipment suppliers. As the revenue mix recalibrates, investors are closely monitoring potential headwinds to equipment ship-to volumes. Additionally, recent corporate disclosures detailing executive insider share sales have added a subtle psychological drag, muting buying enthusiasm in a sensitive market environment.
From a strategic perspective, Applied Materials maintains a dominant competitive position in deposition and etch technologies critical for next-generation semiconductor fabrication. The ongoing expansion of its research initiatives and multi-year order visibility in leading-edge foundry-logic nodes underscore durable secular tailwinds. However, near-term price action reflects a post-earnings repricing phase where high consensus expectations and short-term cost absorption temporarily overshadow strong long-term fundamentals. Institutional investors are likely awaiting margin stabilization and sector-wide sentiment consolidation before re-engaging aggressively.
Technical Analysis of Applied Materials Inc (AMAT)
Technically, Applied Materials Inc (AMAT) shows a MACD (12,26,9) value of -7.313, indicating a sell signal. The RSI at 38.241 suggests neutral condition and the Williams %R at 97.566 suggests oversold condition. Please monitor closely.
Media Coverage of Applied Materials Inc (AMAT)
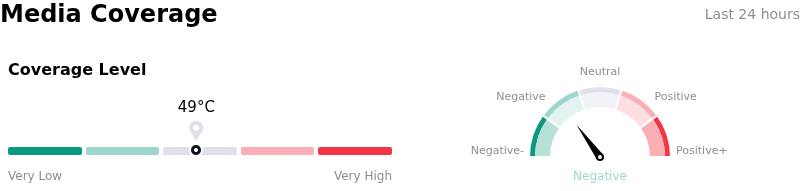
In terms of media coverage, Applied Materials Inc (AMAT) shows a coverage score of 49, indicating a moderate level of media attention. The overall market sentiment index is currently in bearish zone.
Fundamental Analysis of Applied Materials Inc (AMAT)
Applied Materials Inc (AMAT) is in the Technology Equipment industry. Its latest annual revenue is $28.37B, ranking 11 in the industry. The net profit is $7.00B, ranking 8 in the industry. Company Profile
Over the past month, multiple analysts have rated the company as Buy, with an average price target of $635.89, a high of $900.00, and a low of $308.00.
More details about Applied Materials Inc (AMAT)
Company Specific Risks:
- China Revenue Mix Contraction: Recent financial performance and analyst commentary indicate that China’s share of Applied Materials’ overall revenue mix continues to decline under ongoing geopolitical tensions and trade restrictions, threatening long-term growth in its largest geographic market.
- Gross Margin Stagnation Amid Revenue Ramp: Despite delivering record revenue projections, management's outlook indicates flat gross margin guidance, triggering concern among institutional analysts regarding peak profitability, elevated cost structures, and substantial ongoing capital expenditure commitments.
- Wafer Fab Systems Shipment Deceleration: Recent institutional research, including reports from Wall Street firms such as Morgan Stanley, highlights potential slowing in equipment systems shipment growth, exposing the stock to valuation compression after multi-quarter gains.
- Executive Insider Dispositions and Institutional Trimming: Regulatory SEC filings (Form 4 and 13F) disclose open-market stock sales by senior leadership, including CFO Brice Hill, as well as share trimming by prominent institutional asset managers, pressuring intraday trading sentiment.
Recommended Articles


