


XRP (XRPUSD) Fluctuated Significantly on Aug 27: Key Variables Behind the Move
XRP (XRPUSD) is up 2.06% at Aug 27 00:05(ET), now at $1.4075, with a 7-day up of 13.19%.
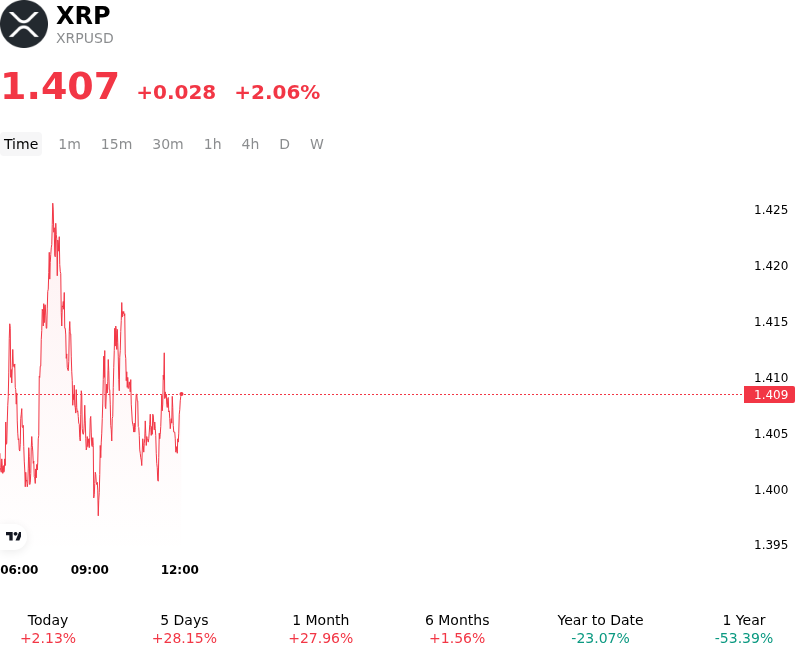
What is driving XRP (XRPUSD)’s stock price up today?
Capital flows into XRP accelerated as institutional interest and improving fundamental metrics across the native ledger reinforced investor confidence. A key structural driver was sustained capital commitment through spot XRP exchange-traded fund products, which have provided a dedicated mechanism for institutional market participants to build exposure. Simultaneously, momentum around Ripple's institutional stablecoin infrastructure generated measurable expansion in network utility, with increasing transfer volumes on the XRP Ledger enhancing medium-term adoption expectations and fee generation dynamics.
Macroeconomic conditions provided an additional tailwind as broader risk asset sentiment remained constructive. Expectations surrounding Federal Reserve monetary policy and manageable Treasury yields continued to encourage capital deployment into high-beta digital assets. Within crypto derivatives markets, the recent recalibration of open interest and normalization of funding rates allowed spot buyers to re-establish control near critical technical support levels. As selling pressure from temporary profit-taking abated, short covering combined with fresh spot buying encouraged market liquidity to deepen.
The broader outlook for XRP remains underpinned by expanding institutional cross-border payment initiatives and real-world asset tokenization efforts on the ledger. While traders continue to monitor potential volatility linked to macroeconomic policy shifts and broader market concentration, current capital flows suggest that institutional positioning and network fundamentals are providing a firmer foundation for price action.
Technical Analysis of XRP (XRPUSD)
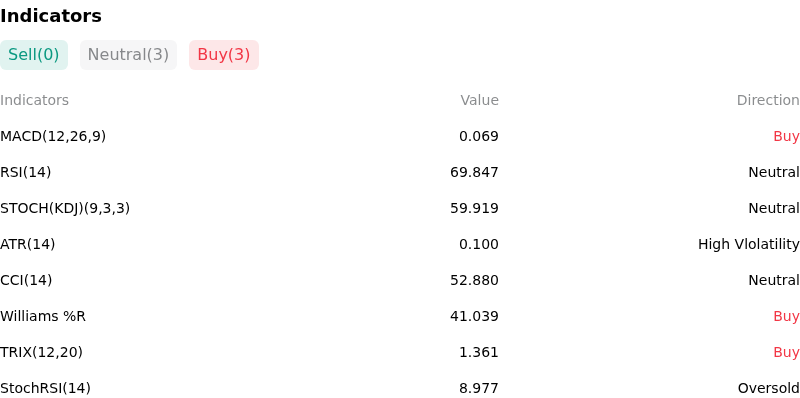
Technically, XRP (XRPUSD) shows a MACD (12,26,9) value of 0.069, indicating a buy signal. The RSI at 69.650 suggests neutral condition and the Williams %R at 41.518 suggests buy condition. Please monitor closely.
More details about XRP (XRPUSD)
Recent Events and Risks:
- Derivatives Deleveraging and Long Liquidation Exposure: Following a sharp rally toward $1.70, an abrupt price pullback triggered over $500 million in XRP long liquidations across major exchanges, while elevated leverage ratios on venues such as Binance leave the market highly vulnerable to secondary liquidation cascades if key support breaks.
- Whale Exchange Deposits and Distribution Concerns: On-chain data revealed large transfers of XRP into centralized exchange wallets, including a reported $175 million deposit by a Ripple co-founder, sparking market fears of institutional profit-taking and introducing immediate spot selling pressure.
- Technical Overhead Rejection and Support Vulnerability: Heavy sell-side rejection at the $1.55–$1.70 resistance zone resulted in buyer exhaustion and momentum decay, leaving XRP exposed to deeper downside testing toward intermediate structural support between $1.35 and $1.40.
- Legislative Obstacles to Federal Regulatory Catalysts: Despite political momentum surrounding U.S. crypto policy and the CLARITY Act, difficult Senate negotiations and low market-implied odds of rapid passage risk unwinding recent regulatory risk-premium gains built into XRP pricing.
Recommended Articles


