


TTM Technologies Inc Stock (TTMI) Moved Up by 9.21% on Aug 26: Facts Behind the Movement
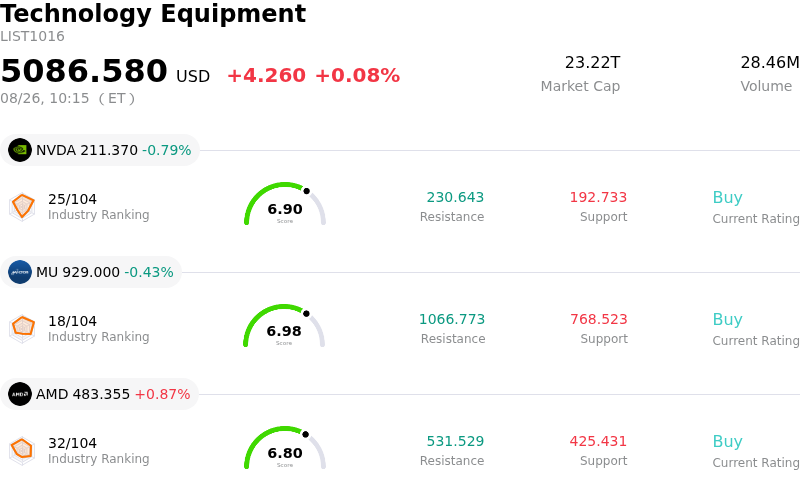
TTM Technologies Inc (TTMI) moved up by 9.21%. The Technology Equipment sector is up by 0.08%. The company outperformed the industry. Top 3 stocks by turnover in the sector: NVIDIA Corp (NVDA) down 0.63%; Micron Technology Inc (MU) down 0.37%; Advanced Micro Devices Inc (AMD) up 0.87%.
What is driving TTM Technologies Inc (TTMI)’s stock price up today?
The primary catalyst behind the sharp intraday rally and heightened volatility in TTM Technologies is a high-profile insider transaction disclosed in regulatory filings. President and Chief Executive Officer Edwin Roks executed a significant open-market purchase of 10,000 common shares, substantially increasing his direct stake following a period of recent stock weakness. Executive open-market purchases of this magnitude are widely viewed by institutional and retail investors as an explicit vote of confidence in the underlying strength and long-term valuation of the business, effectively halting a recent multi-day downward trend and spurring aggressive dip-buying across the market.
This influx of buying interest is underpinned by solid operational momentum. TTM Technologies recently reported strong quarterly financial results, delivering record revenue that breached milestone levels alongside substantial year-over-year top-line and earnings-per-share growth. The performance was spearheaded by surging demand for advanced printed circuit boards and microelectronic assemblies tailored for artificial intelligence data center infrastructure, complemented by resilient defense and aerospace program backlogs. Furthermore, the company's recent strategic agreement to acquire Epiq Solutions for $1.1 billion expands its operational footprint into high-margin, AI-enabled software-defined radios and defense systems, reinforcing positive mid-term growth expectations.
From a technical and market sentiment perspective, the stock's upward surge reflects a sharp momentum reversal following oversold conditions caused by prior profit-taking. Wall Street analysts have maintained an overwhelmingly bullish outlook, backed by upward earnings estimate revisions and favorable ratings upgrades from major research firms. The combination of executive insider buying, strong secular tailwinds in AI hardware deployment, and attractive post-correction valuation levels created a potent setup for institutional short-covering and renewed capital inflows, driving significant positive price action.
Technical Analysis of TTM Technologies Inc (TTMI)
Technically, TTM Technologies Inc (TTMI) shows a MACD (12,26,9) value of -0.904, indicating a sell signal. The RSI at 45.774 suggests neutral condition and the Williams %R at 54.985 suggests neutral condition. Please monitor closely.
Fundamental Analysis of TTM Technologies Inc (TTMI)
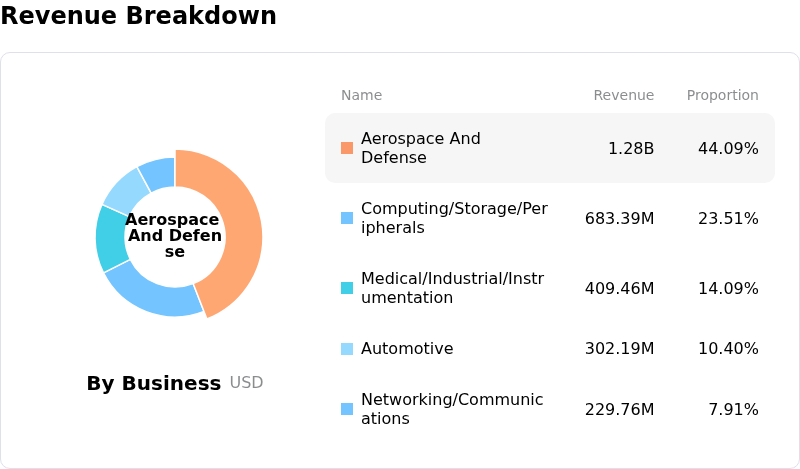
TTM Technologies Inc (TTMI) is in the Technology Equipment industry. Its latest annual revenue is $2.91B, ranking 32 in the industry. The net profit is $177.45M, ranking 35 in the industry. Company Profile
Over the past month, multiple analysts have rated the company as Buy, with an average price target of $206.40, a high of $224.00, and a low of $175.00.
More details about TTM Technologies Inc (TTMI)
Company Specific Risks:
- Epiq Solutions Acquisition and Balance Sheet Leverage: Recent market scrutiny surrounding the $1.1 billion acquisition of Epiq Solutions has driven volatility due to high debt load and delayed financial return. The transaction, funded entirely through senior secured debt, pushes net leverage up from 0.9x to 2.3x with only $9 million in projected annual EBITDA synergies, leaving EPS accretion delayed until 2028.
- Severe Multi-Day Drawdown and Valuation Overhang: TTMI has suffered a sharp 5-day selloff totaling a 24% decline, pulling shares more than 50% below their 52-week high of $223.83. Institutional analysts caution that the stock's elevated price-to-earnings ratio (~48–50x) leaves it highly vulnerable to repricing if AI hardware demand cools.
- Executive Insider Dispositions: SEC Form 4 and Rule 144 filings disclose ongoing insider share liquidations, including sales by the Chief Financial Officer and key Executive Vice Presidents. Dispositions during a period of debt expansion for pending acquisitions have fueled investor skepticism regarding executive alignment.
- High-Beta Exposure to Hardware Sector Volatility: Carrying a high beta of 2.14, the stock has experienced amplified intraday selling pressure amidst broader semiconductor and hardware sector pullbacks. Rising long-term Treasury yields and macroeconomic caution have forced institutional investors to reduce exposure to capital-intensive printed circuit board (PCB) suppliers.
Recommended Articles


