


Nebius Group NV Stock (NBIS) Closed Up by 5.24% on Aug 25: What Investors Need To Know
Nebius Group NV (NBIS) closed up by 5.24%. The Industrial & Commercial Services sector is down by 0.09%. The company outperformed the industry. Top 3 stocks by turnover in the sector: Nebius Group NV (NBIS) up 5.24%; Comfort Systems USA Inc (FIX) down 2.97%; Dycom Industries Inc (DY) down 7.65%.
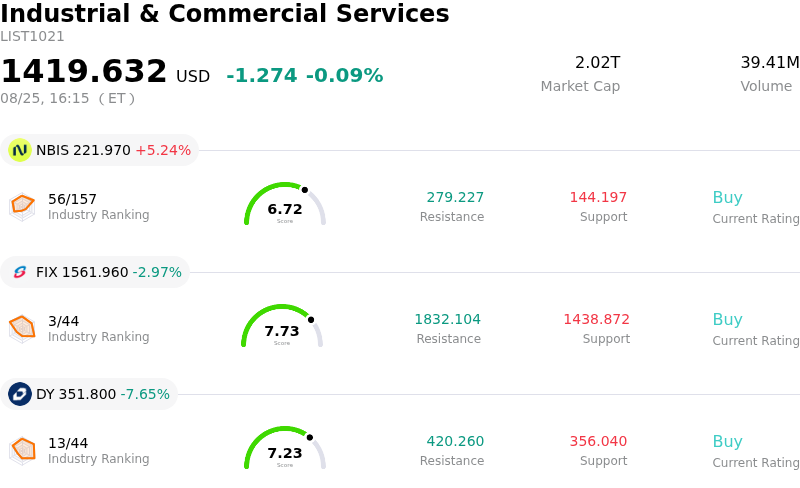
What is driving Nebius Group NV (NBIS)’s stock price up today?
Nebius Group experienced a notable upward rebound, effectively snapping a multi-session losing streak driven by investor concerns over prospective capital raises and equity dilution. The primary driver behind the positive price movement was the successful completion of an upsized convertible debt offering, which surpassed initial fundraising targets due to strong institutional demand. After several days of selling pressure as market participants digested the initial announcement of capital raising, the execution of the offering removed significant liquidity uncertainty and served as a vote of confidence from institutional investors.
The terms of the offering provided additional reassurance to the market. Featuring low coupon rates and conversion prices set at substantial premiums above recent trading levels, the debt structure helps minimize immediate dilution while keeping ongoing interest expenses manageable. This capital injection provides the neocloud provider with the resources required to fund its capital expenditure plans, including the procurement of high-performance hardware, expansion of data center capacity, and scaling of its full-stack artificial intelligence cloud platform to meet elevated computing demand.
Broader market dynamics within the AI infrastructure and data center sectors also lent momentum to the recovery. Although market sentiment across capital-intensive technology companies has shown heightened sensitivity to debt levels, sustained demand for AI compute capacity continues to underpin institutional interest in cloud platform providers. With financing secured to support its backlog and revenue growth trajectory, market sentiment shifted back toward fundamental execution and infrastructure expansion.
Technical Analysis of Nebius Group NV (NBIS)
Technically, Nebius Group NV (NBIS) shows a MACD (12,26,9) value of -1.752, indicating a neutral signal. The RSI at 50.554 suggests neutral condition and the Williams %R at 58.743 suggests sell condition. Please monitor closely.
Fundamental Analysis of Nebius Group NV (NBIS)
Nebius Group NV (NBIS) is in the Industrial & Commercial Services industry. Its latest annual revenue is $529.80M, ranking 113 in the industry. The net profit is $82.50M, ranking 73 in the industry. Company Profile
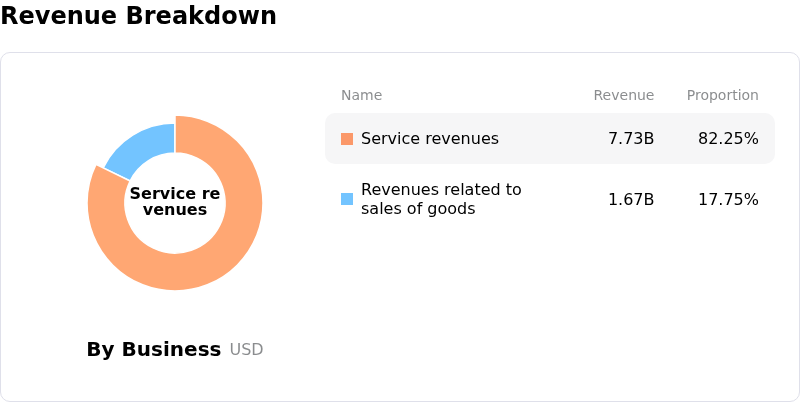
Over the past month, multiple analysts have rated the company as Buy, with an average price target of $279.55, a high of $410.00, and a low of $78.34.
More details about Nebius Group NV (NBIS)
Company Specific Risks:
- Dilution and Debt Expansion via $5.75 Billion Convertible Offering: Nebius recently concluded an upsized $5.75 billion convertible senior notes issuance to finance AI infrastructure, driving a multi-day sell-off as investors weigh near-term equity dilution dynamics and increased supply of convertible debt paper.
- Surging Debt Load and Escalating Interest Expenses: Aggressive capital deployment has expanded total debt to over $8.5 billion, resulting in an alarming 2,381% year-over-year surge in quarterly interest expenses to $119.1 million and raising balance-sheet sustainability concerns among institutional analysts.
- Data Center Regulatory Restrictions and Infrastructure Execution Bottlenecks: Emerging regional regulatory hurdles, including New York's one-year moratorium on new hyperscale data centers, combined with power availability challenges across North American and European facilities, create significant execution risks for scaling planned GPU capacity.
- Extreme Valuation Multiples and High-Beta Intraday Volatility: Trading at elevated price-to-sales metrics and influenced by speculative retail momentum, NBIS exhibits sharp intraday downside volatility during broader technology sector pullbacks or growth-oriented risk-off rotations.
Recommended Articles


