


Corn Futures (CORN-F) Is up 2.02% on Aug 23: Key Drivers to Watch
Corn Futures (CORN-F) is up 2.02% at Aug 23 20:10(ET), now at $492.54, with a 7-day up of 6.19%.
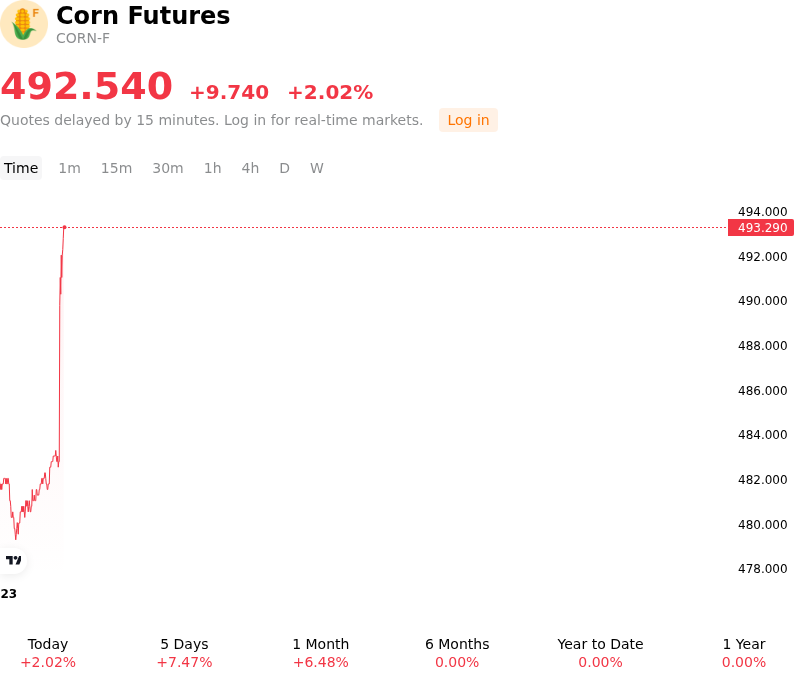
What is driving Corn Futures (CORN-F)’s stock price up today?
The sharp upward momentum in corn futures was primarily catalyzed by significant downward revisions to U.S. production expectations following the conclusion of the annual Pro Farmer Crop Tour. Independent field inspections across major Midwestern growing regions revealed widespread crop damage stemming from summer weather stress, including extreme heat waves, erratic precipitation, and localized flooding. These adverse conditions compromised crop health during critical pollination and grain-filling stages, resulting in subpar ear populations, shorter grain lengths, and reduced field yields in major producing states like Iowa and Illinois. The tour's final national yield estimate came in markedly below the U.S. Department of Agriculture's latest official forecast, confirming that the upcoming U.S. harvest will fall substantially short of earlier trade projections.
This yield reduction forced institutional investors to aggressively reprice the global corn balance sheet, amplifying concerns over tightening domestic inventory levels. A supply contraction of this scale threatens to pull the U.S. corn stocks-to-use ratio under key critical thresholds, creating a backdrop where market prices must rise to ration forward demand. Supply concerns extend beyond the U.S. Corn Belt, as consecutive summer heat waves across Europe severely curtailed harvest expectations in key countries like France, while ongoing geopolitical disruptions in the Black Sea continued to jeopardize Eastern European grain shipping reliability. Furthermore, despite large overall production in South America, expanding domestic industrial utilization in Brazil for corn ethanol has constrained net exportable surpluses, limiting international supply relief.
On the demand side, steady international purchases and competitive U.S. Gulf export pricing continued to support physical market fundamentals. Recent flash sales to overseas buyers highlighted strong export commitment heading into harvest. From a technical and capital flow perspective, the dramatic yield downgrade triggered significant short-covering and speculative buying among institutional funds. As nearby and new-crop futures cleared key psychological and technical resistance thresholds, systematic momentum buying accelerated, driving prices to multi-month highs and reinforcing a broader bullish structural trend driven by tightening global balance sheet expectations.
Technical Analysis of Corn Futures (CORN-F)
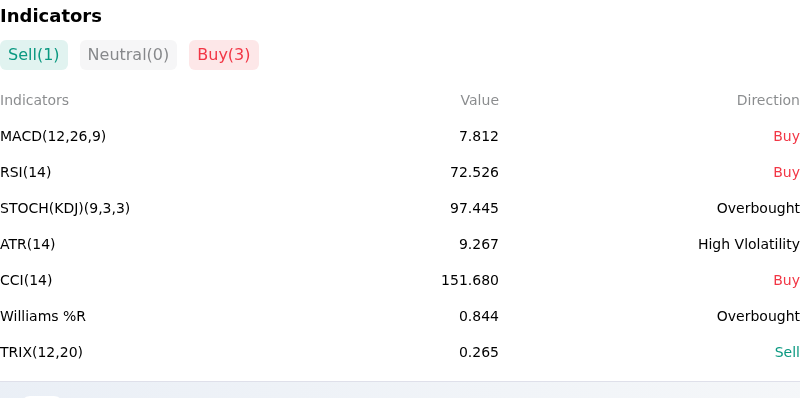
Technically, Corn Futures (CORN-F) shows a MACD (12,26,9) value of 7.812, indicating a buy signal. The RSI at 72.526 suggests buy condition and the Williams %R at 0.844 suggests overbought condition. Please monitor closely.
More details about Corn Futures (CORN-F)
Recent Events and Risks:
- Harvest Pressure and Commercial Producer Selling: As corn futures test key resistance near the $5.00 per bushel level, market strategists are actively advising producers to aggressively market remaining old-crop inventory and lock in new-crop sales before harvest ramps up, introducing commercial hedging pressure and cash market overhead.
- Weak Cash Basis and Ample Spot Availability: Despite the speculative futures rally driven by crop tour yield concerns, national average cash basis remains unusually weak and deferred futures spreads continue to carry, signaling that local end-users and processors are not experiencing physical supply shortages.
- Technical Overhead Resistance and Long Unwinding: Following a multi-week rally of 40 to 50 cents toward multi-month highs near $5.00–$5.05 per bushel, futures are facing strong technical resistance, leaving the market highly vulnerable to profit-taking and long liquidation if daily bullish yield news subsides.
- Export Competitiveness Risks From High Prices: Elevated benchmark futures threaten to erode the relative price competitiveness of US corn against alternative global grain origins and feed substitutes like wheat, creating potential demand destruction in export channels.
Recommended Articles


