


Natural Gas (NATGAS) Is up 2.03% on Aug 21: What Changed in Supply and Demand?
Natural Gas (NATGAS) is up 2.03% at Aug 21 04:10(ET), now at $2.811, with a 7-day up of 3.16%.
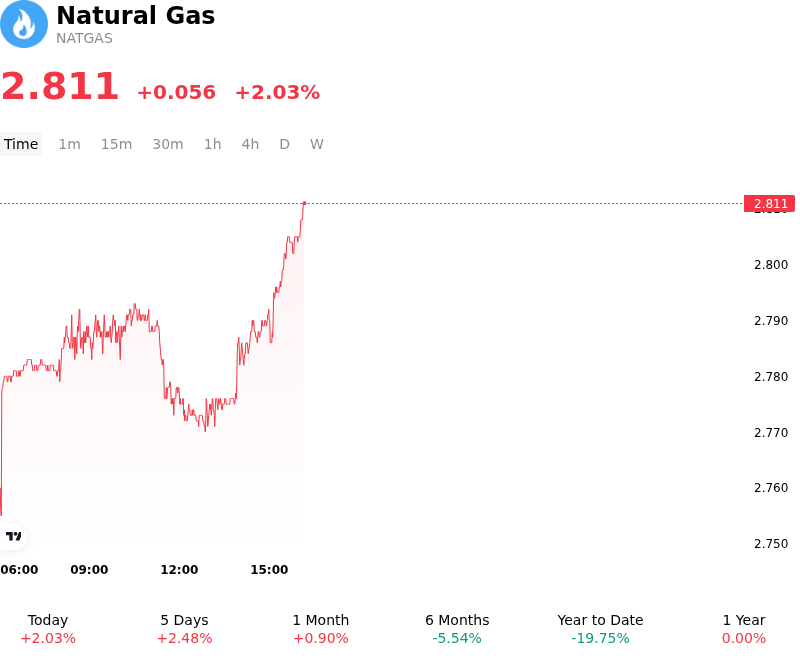
What is driving Natural Gas (NATGAS)’s stock price up today?
Natural gas futures advanced as persistent late-summer extreme heat across the Southern and Western regions of the United States continued to drive elevated power-sector demand for air conditioning. High summer temperatures boosted cooling degree days, forcing electric utilities to burn substantial volumes of natural gas to meet peak grid loads. This robust domestic burn provided immediate support to prompt-month contracts, encouraging short-covering activity following recent technical pullbacks.
The underlying fundamental catalyst behind the price rebound stemmed from the U.S. Energy Information Administration weekly natural gas storage report. The agency reported a modest injection of 16 billion cubic feet into Lower-48 underground storage, falling significantly short of the five-year average seasonal build of 29 billion cubic feet. The lighter-than-normal accumulation further narrowed the historical inventory surplus relative to five-year benchmarks, highlighting how regional summer heat is actively curbing seasonal storage builds.
Within the inventory data, market participants noted a distinct regional imbalance, characterized by net withdrawals from South Central salt storage facilities. Intense regional cooling demand in Texas and the broader Gulf Coast region forced utilities to draw down high-deliverability salt caverns, effectively counterbalancing injections in the East and Midwest. Additionally, steady liquefied natural gas feedgas flows to Gulf Coast export facilities provided an underlying floor for demand, absorbing a portion of domestic production.
Despite the session's bullish repricing, institutional investors remain cautious regarding the broader structural market balance. U.S. dry gas production continues to run near record levels above 111 billion cubic feet per day, underpinned by resilient associated gas output from Permian Basin crude operations and steady Haynesville drilling. With total inventories remaining comfortably elevated and projected to enter the winter heating season near historic highs, market participants continue to balance near-term weather support against long-term oversupply risks and approaching shoulder-season weather transitions.
Technical Analysis of Natural Gas (NATGAS)
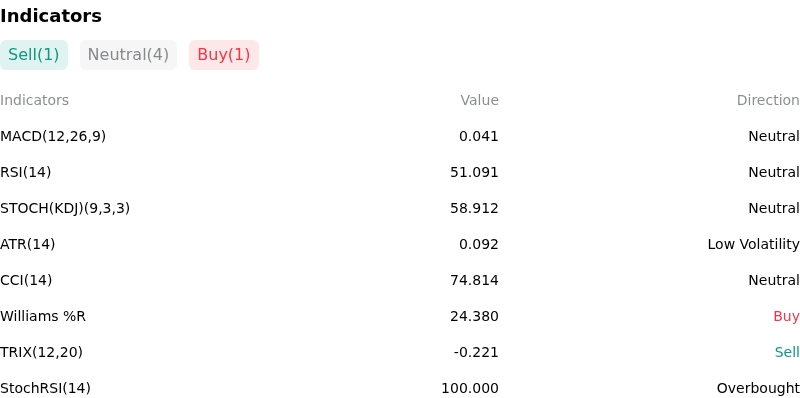
Technically, Natural Gas (NATGAS) shows a MACD (12,26,9) value of 0.041, indicating a neutral signal. The RSI at 51.091 suggests neutral condition and the Williams %R at 24.380 suggests buy condition. Please monitor closely.
More details about Natural Gas (NATGAS)
Recent Events and Risks:
- Persistent Storage Surplus and Record Inventory Outlook: The latest EIA weekly storage report showed U.S. working natural gas inventories rising to 3,169 Bcf, maintaining a 185 Bcf surplus above the five-year average and reinforcing official projections that pre-winter storage will reach a record 3,985 Bcf.
- Resilient Dry Gas Production Gains: Lower 48 dry natural gas output continues to run near elevated levels between 110.9 and 111 Bcf/d, driven by strong Permian and Northeast flows that keep domestic supply abundant and limit sustained price rallies.
- LNG Feedgas Demand Bottlenecks: Export demand remains restricted due to extended maintenance turnarounds at Freeport LNG and sluggish capacity ramp-ups at Golden Pass, curtailing overall feedgas intake and diverting excess volumes into domestic underground storage.
- Fading Seasonal Cooling Demand: Weather-driven power burn is experiencing late-summer weakness as milder temperatures across Midwest and Northeast population centers lower overall domestic gas demand toward 116.8 Bcf/d from peak summer levels near 125 Bcf/d.
Recommended Articles


