


Bitcoin (BTCUSD) Volatility Intensified on Aug 20: What You Should Know
Bitcoin (BTCUSD) is up 1.06% at Aug 20 02:45(ET), now at $69752.8, with a 7-day up of 10.05%.
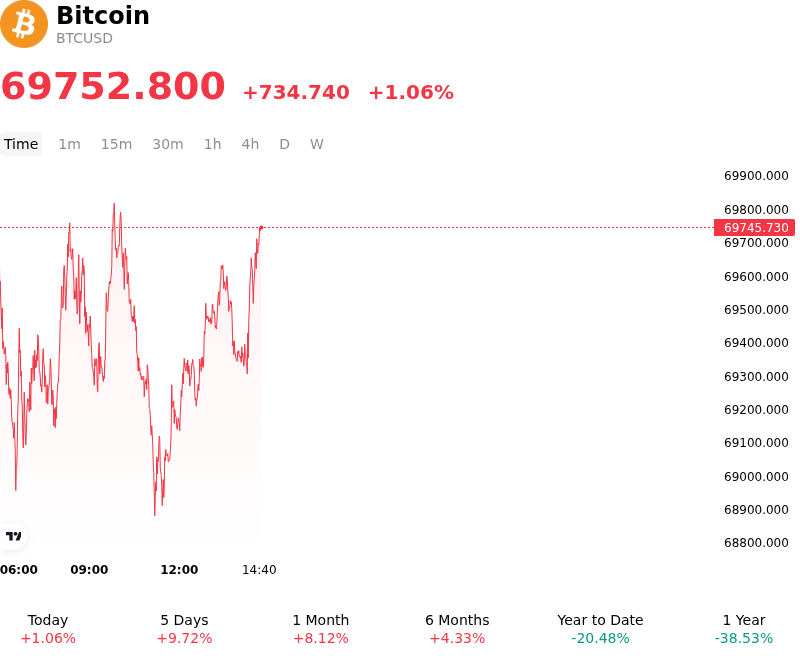
What is driving Bitcoin (BTCUSD)’s stock price up today?
Bitcoin advanced as favorable macroeconomic shifts, institutional capital deployment, and derivatives market positioning combined to boost risk appetite across digital assets. A key catalyst was a pronounced softening in U.S. Treasury yields and a weaker U.S. Dollar Index, driven by sovereign debt management announcements and dovish Federal Reserve policy expectations. Lower benchmark yields reduced the opportunity cost of holding non-yielding alternative assets, while enhanced global fiat liquidity expectations reinforced Bitcoin's long-term store-of-value narrative. This macroeconomic tailwind revitalized institutional demand following a period of range-bound consolidation, providing a supportive liquidity foundation for upside price discovery.
Institutional participation demonstrated renewed momentum, evidenced by positive net inflows into U.S. spot Bitcoin ETFs that effectively ended a prior stretch of redemption pressure. Concurrently, on-chain data highlighted persistent balance-sheet expansion by large-scale market participants, with institutional entities and long-term whales accumulating significant spot positions over the preceding weeks. Investor confidence was further bolstered by constructive regulatory dialogues in Washington and proposed regulatory capital-raising exemptions, which reduced policy uncertainty and reinforced expectations for deeper institutional integration into traditional finance.
From a market structure perspective, the initial spot-driven momentum expanded rapidly as price action cleared key overhead technical resistance levels. This move caught leveraged derivatives traders off guard after a period of concentrated bearish positioning, triggering a substantial cascade of forced short liquidations. The forced buy-backs by short sellers accelerated intraday upward velocity, compounding spot inflows with algorithmic short covering. While derivatives leverage has partially recalibrated following the liquidation wave, institutional market participants continue to evaluate potential macroeconomic headwinds, including upcoming central bank rate decisions, fiscal issuance dynamics, and ongoing regulatory legislative progress. Overall, the shift reflects a structural improvement in capital inflows and broader risk sentiment.
Technical Analysis of Bitcoin (BTCUSD)
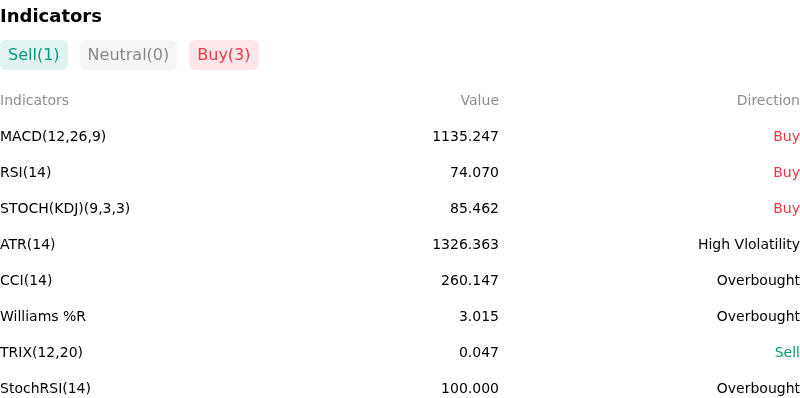
Technically, Bitcoin (BTCUSD) shows a MACD (12,26,9) value of 1135.247, indicating a buy signal. The RSI at 74.070 suggests buy condition and the Williams %R at 3.015 suggests overbought condition. Please monitor closely.
More details about Bitcoin (BTCUSD)
Recent Events and Risks:
- Institutional ETF Net Capital Outflows: Persistent net withdrawals from U.S. spot Bitcoin ETFs—totaling roughly $385 million over recent sessions—continue to drain spot market liquidity, erecting strong overhead resistance near $65,000 and signaling subdued institutional demand.
- High Derivatives Leverage and Liquidation Risk: A sharp build-up in perpetual futures open interest has pushed the futures-to-spot volume ratio above 7.8x, leaving the market overleveraged and vulnerable to cascading long liquidations if price breaks below key support at $64,000.
- Deteriorating Spot Demand and Liquidity Squeezes: On-chain taker buy volume has dropped to multi-year lows, pointing to a lack of active spot buyers available to absorb market orders as substantial downside liquidation clusters sit between $62,000 and $62,500.
- Regulatory Hesitation and Macro Sensitivity: Unexpected regulatory friction, including the SEC's abrupt cancellation of a key crypto rules meeting, alongside elevated benchmark Treasury yield volatility, continues to create risk-off sentiment and limit fresh institutional allocations.
Recommended Articles


