


WTI Futures (USOIL-F) Is up 2.08% on Aug 20: What You Need to Watch
WTI Futures (USOIL-F) is up 2.08% at Aug 20 04:30(ET), now at $86.1, with a 7-day up of 6.13%.
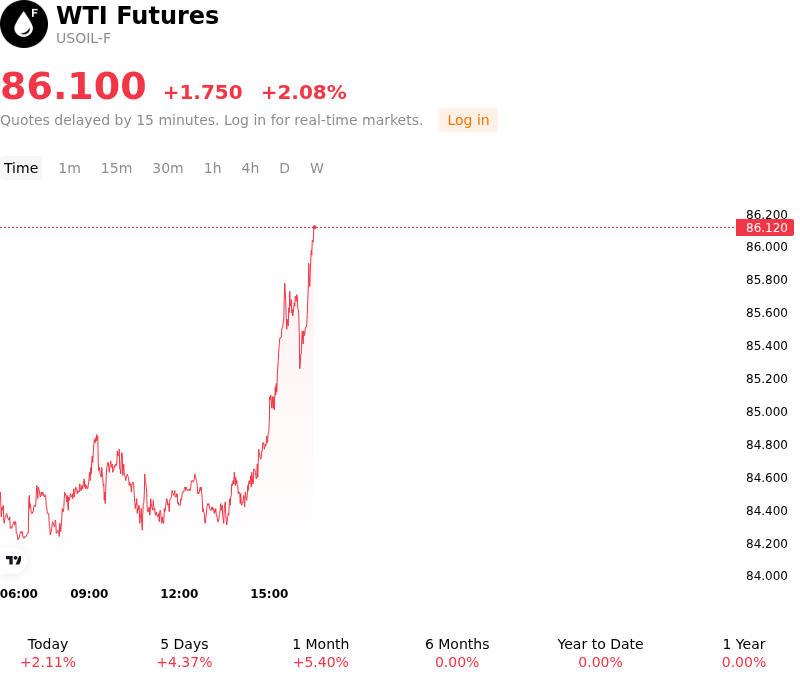
What is driving WTI Futures (USOIL-F)’s stock price up today?
West Texas Intermediate crude oil advanced as heightened geopolitical friction in the Middle East reinforced supply disruption risks across major maritime chokepoints. Persistent uncertainty regarding transit safety through the Strait of Hormuz, alongside escalations in regional diplomatic and economic standoffs, spurred renewed short-covering and risk-premium expansion among institutional participants. With physical flows remaining vulnerable to potential logistical bottlenecks, market expectations recalibrated to incorporate a higher structural price floor.
The upward momentum was further sustained by strong downstream processing fundamentals that overshadowed a headline accumulation in U.S. crude stockpiles. Although weekly Energy Information Administration data revealed a build in commercial crude inventories, market focus shifted toward refinery utilization rates, which surged to near-capacity levels. High refinery throughput underscored robust feedstock demand from domestic processors, while distillate inventories experienced a significant draw, dropping to multi-month lows. Furthermore, storage levels at the Cushing, Oklahoma delivery hub continued to contract, signaling localized physical tightness in key U.S. distribution nodes.
Macroeconomic factors provided additional tailwinds, as a softer U.S. dollar and easing long-term Treasury yields enhanced the appeal of dollar-denominated commodities. The convergence of tight refined product spreads, elevated domestic refinery demand, and persistent geopolitical supply constraints outweighed broader demand uncertainties. While institutional investors continue to monitor global macroeconomic conditions and inventory trajectory risks, the prevailing market structure reflects a dominant supply-side risk premium and robust physical demand for crude feedstock.
Technical Analysis of WTI Futures (USOIL-F)
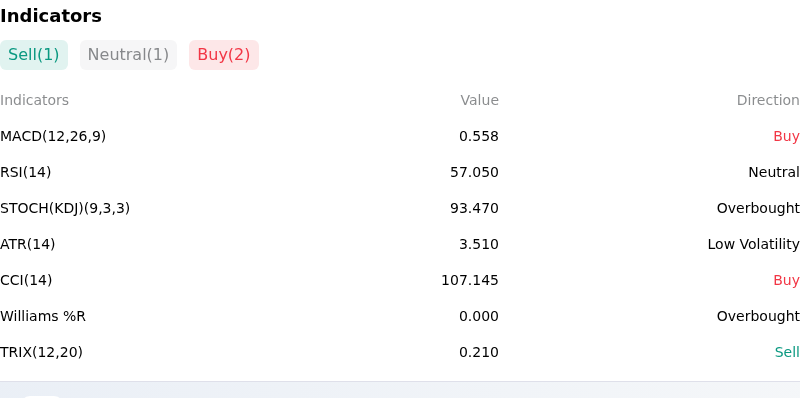
Technically, WTI Futures (USOIL-F) shows a MACD (12,26,9) value of 0.558, indicating a buy signal. The RSI at 57.050 suggests neutral condition and the Williams %R at 0.000 suggests overbought condition. Please monitor closely.
More details about WTI Futures (USOIL-F)
Recent Events and Risks:
- Unexpected U.S. Commercial Crude Inventory Builds: Weekly Energy Information Administration (EIA) data revealed unexpected builds in domestic commercial crude stockpiles, highlighted by a recent 4.4 million barrel accumulation following a prior massive 17.4 million barrel surge, as reduced export flows and rising imports weaken domestic market tightness.
- Global Demand Forecast Downgrades and Destruction: Major forecasting bodies including the IEA and OPEC slashed their 2026 global oil demand projections—with the IEA projecting an outright consumption contraction of 1.6 million barrels per day—warning that sustained high fuel costs are causing structural demand destruction across key consuming sectors.
- Macroeconomic Headwinds and Chinese Demand Weakness: Persistent economic drag in China combined with heightened global stagflation and recession risks is dampening industrial throughput expectations and curtailing fuel consumption, generating ongoing macro risk-off pressure across crude futures.
- Speculative Positioning Unwind Against Technical Resistance: Market participants are unwinding long futures positions as demand-side destruction narratives increasingly overshadow Middle East geopolitical supply risk premiums, capping rallies near key technical moving averages and leaving the complex vulnerable to intraday liquidation.
Recommended Articles


