


Solana (SOLUSD) Suddenly Goes up 1.05% on Aug 20: What You Need to Watch
Solana (SOLUSD) is up 1.05% at Aug 20 00:05(ET), now at $83.59, with a 7-day up of 11.13%.
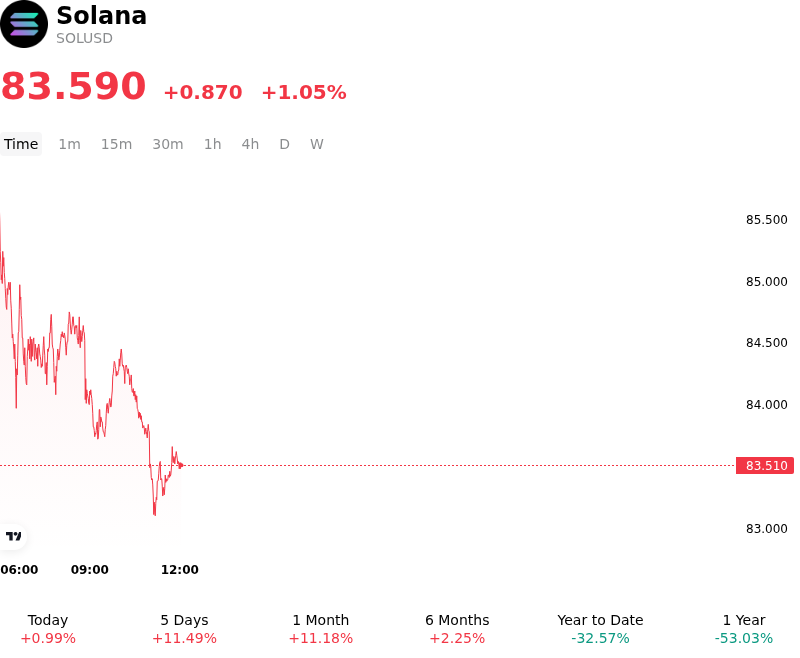
What is driving Solana (SOLUSD)’s stock price up today?
Capital flowed into Solana as sustained institutional demand through spot SOL exchange-traded products provided a firm liquidity floor. Continued net inflows into spot Solana vehicles, particularly yield-focused staking ETF products, highlighted ongoing allocation from institutional investors seeking high-performance Layer-1 exposure alongside native staking yields. This steady influx of institutional capital absorbed spot market supply, strengthening order book depth and reinforcing buyer confidence across major spot venues.
Network-level technical catalysts also provided fundamental support to investor sentiment. Progress on core validator client upgrades, specifically governance and software developments aimed at incrementally lowering block slot times and optimizing computational throughput, boosted long-term adoption expectations. The planned reduction in slot latency and state storage costs reinforced Solana's technical edge relative to competing smart-contract platforms. Simultaneously, robust on-chain metrics—driven by elevated trading volume across decentralized exchanges and active automated market makers—demonstrated that price appreciation was supported by underlying network utilization rather than purely speculative turnover.
Broader regulatory and macro tailwinds further enhanced risk appetite across high-beta digital assets. Policy discussions surrounding clear market structure legislation and potential SEC regulatory exemptions in the United States contributed to an improving regulatory outlook. In derivatives markets, positioning remained constructively aligned with spot buyers, characterized by healthy open interest near key support levels and long-biased positioning on primary derivatives exchanges, signaling that institutional allocators viewed the current trading environment as a favorable accumulation phase.
Technical Analysis of Solana (SOLUSD)
Technically, Solana (SOLUSD) shows a MACD (12,26,9) value of 1.911, indicating a buy signal. The RSI at 72.746 suggests buy condition and the Williams %R at 17.968 suggests overbought condition. Please monitor closely.
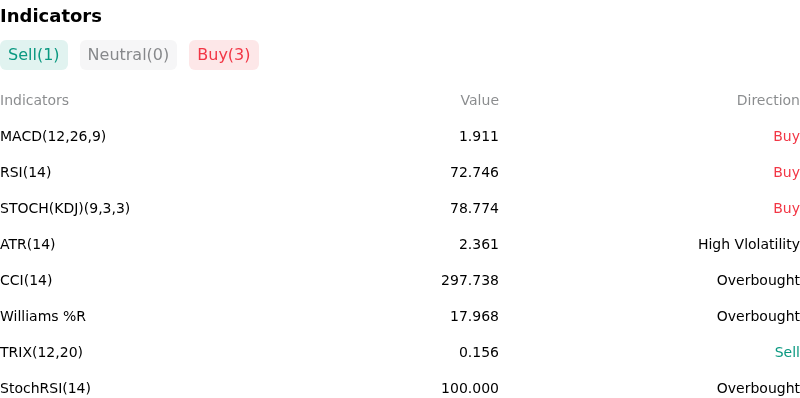
More details about Solana (SOLUSD)
Recent Events and Risks:
- Infrastructure Vulnerabilities and Consensus Risks: A major routing failure at key infrastructure provider Teraswitch caused over 28% of staked SOL and 102 validators to go offline simultaneously, bringing the network dangerously close to its 33.3% consensus halt threshold and re-exposing structural node centralization concerns.
- Stagnant Institutional Inflows and ETF Demand: Spot Solana ETFs in the United States have logged prolonged stretches of zero net daily inflows alongside sporadic capital outflows, signaling a sharp slowdown in institutional capital allocation that leaves spot prices vulnerable without primary market buying support.
- Whale Position Unwinds and Liquidation Threats: Futures market positioning shows heavy long-position unwinds by prominent whale traders, increasing the threat of sudden deleveraging events and a breakdown below key technical support in the $70–$68 price zone.
- Token Inflation and Layer-2 Competitive Pressures: Unresolved governance discussions around annual token emission cuts, combined with persistent market share erosion from competing Ethereum Layer-2 scaling networks, continue to weigh on SOL's network fee accrual and valuation metrics.
Recommended Articles


