


Mitsubishi UFJ Financial Group Inc Stock (MUFG) Moved Down by 4.47% on Aug 19: Key Drivers Unveiled
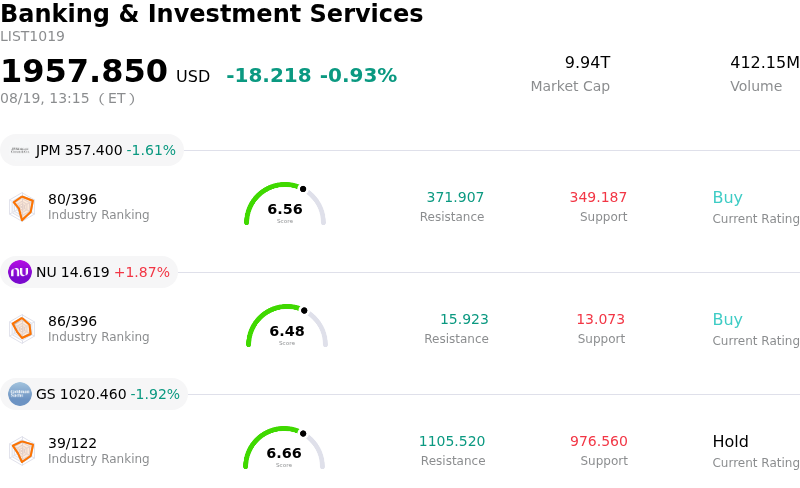
Mitsubishi UFJ Financial Group Inc (MUFG) moved down by 4.47%. The Banking & Investment Services sector is down by 0.93%. The company underperformed the industry. Top 3 stocks by turnover in the sector: JPMorgan Chase & Co (JPM) down 1.61%; Nu Holdings Ltd (NU) up 1.87%; Goldman Sachs Group Inc (GS) down 1.92%.
What is driving Mitsubishi UFJ Financial Group Inc (MUFG)’s stock price down today?
Mitsubishi UFJ Financial Group experienced a notable decline during the trading session, primarily driven by broad-based weakness in Japanese equities and growing volatility across global financial markets. A widespread pull-back across Asian and global benchmarks dragged down major financial holdings, as the broader Nikkei and Topix indices faced selling pressure. Weakness in technology shares alongside heightened global macroeconomic uncertainty contributed to risk-off sentiment, impacting cross-listed Japanese financial institutions trading on U.S. exchanges.
A primary driver of the sector-wide decline stems from developments in the Japanese fixed-income and monetary policy landscape. Japanese government bond yields climbed to multi-decade highs amid intensifying speculation that the Bank of Japan may accelerate its interest rate hikes in upcoming meetings to counter persistent inflationary pressures and currency weakness. While higher domestic policy rates typically enhance net interest income over the long horizon, sharp and rapid yield curve adjustments generate near-term turbulence, raising concerns over fixed-income portfolio valuations and shifting capital flows across Japanese commercial banks.
The movement also reflects institutional profit-taking following a period of strong performance. Earlier in the month, Mitsubishi UFJ delivered robust quarterly earnings that surpassed consensus expectations, supported by strong corporate lending and investment banking revenue. In the absence of negative firm-specific catalysts, today's decline appears to be driven by institutional investors rebalancing portfolios and taking profits amid rising energy prices, bond market volatility, and global equity adjustments.
Technical Analysis of Mitsubishi UFJ Financial Group Inc (MUFG)
Technically, Mitsubishi UFJ Financial Group Inc (MUFG) shows a MACD (12,26,9) value of -0.042, indicating a neutral signal. The RSI at 56.320 suggests neutral condition and the Williams %R at 36.364 suggests buy condition. Please monitor closely.
Fundamental Analysis of Mitsubishi UFJ Financial Group Inc (MUFG)
Mitsubishi UFJ Financial Group Inc (MUFG) is in the Banking & Investment Services industry. Its latest annual revenue is $42.22B, ranking 10 in the industry. The net profit is $11.47B, ranking 8 in the industry. Company Profile
Over the past month, multiple analysts have rated the company as Strong Buy, with an average price target of $25.18, a high of $25.18, and a low of $25.18.
More details about Mitsubishi UFJ Financial Group Inc (MUFG)
Company Specific Risks:
- Valuation Fatigue and Unchanged Earnings Guidance: Despite reporting strong first-quarter fiscal profits, management maintained its full-year net profit guidance without upward revisions, leading institutional analysts at Morningstar to warn that shares are currently rich and vulnerable to profit-taking.
- Technical MACD Breakdown and Distribution: Technical analysis from August 13–14, 2026, revealed a MACD sell signal and a pivot top reversal after the stock failed to break through key resistance at $23.25, accompanied by rising trading volume on falling prices that signals institutional unwinding.
- Capital Adequacy Ratio Below Target Range: Recent risk assessments highlight that MUFG's Common Equity Tier 1 (CET1) ratio sits near 9.2%, remaining below management's optimal 9.5%–10.5% target range, which restricts capital allocation flexibility and limits capacity for expanded share buybacks.
- Credit Cost Provisions and Foreign Portfolio Exposure: Quarterly filings and analyst commentary emphasize rising credit costs—driven by loss provisions on international lending portfolios, including Middle East risk exposures—as well as ongoing restructuring uncertainties concerning overseas subsidiaries like PT Bank Danamon.
Recommended Articles


