


Thermo Fisher Scientific Inc Stock (TMO) Moved Up by 3.67% on Aug 19: Facts Behind the Movement
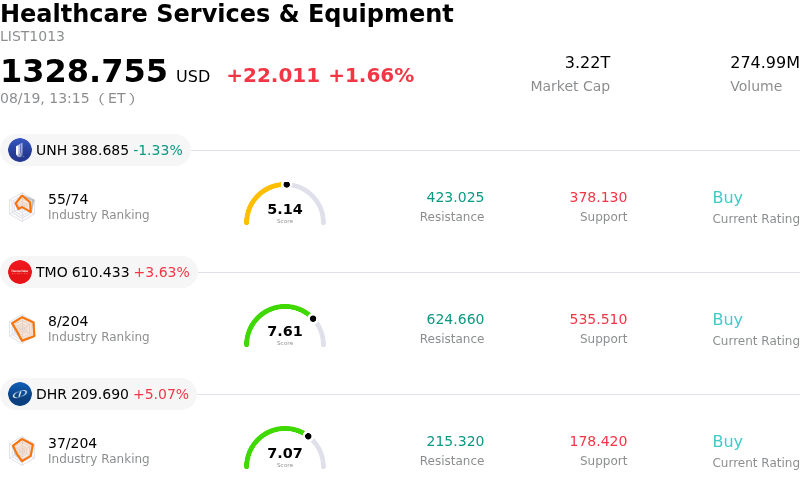
Thermo Fisher Scientific Inc (TMO) moved up by 3.67%. The Healthcare Services & Equipment sector is up by 1.66%. The company outperformed the industry. Top 3 stocks by turnover in the sector: Unitedhealth Group Inc (UNH) down 1.33%; Thermo Fisher Scientific Inc (TMO) up 3.70%; Danaher Corp (DHR) up 5.07%.
What is driving Thermo Fisher Scientific Inc (TMO)’s stock price up today?
Thermo Fisher Scientific demonstrated upward price momentum, driven by a combination of resilient fundamental performance, strategic portfolio optimization, and sustained institutional interest. The company recently reported strong second-quarter financial results that surpassed Wall Street estimates on both top and bottom lines. Driven by accelerating organic growth across its core segments, particularly within pharma and biotech end-markets, Thermo Fisher raised its full-year financial outlook. Demand recovery in life sciences research, active biomanufacturing funding, and robust biopharma capital expenditures have fortified investor confidence in the company's multi-year growth trajectory.
The company's strategic portfolio management has further supported market sentiment. Thermo Fisher recently completed the sale of its microbiology business to private equity firm Astorg for over one billion dollars, allowing management to streamline operations and reallocate capital toward higher-margin, high-growth opportunities. Additionally, the company continues to advance its technological capabilities through innovative product launches, such as AI-driven mass spectrometry platforms and automated laboratory workflows, while expanding its geographic footprint in high-growth emerging markets. These operational initiatives enhance product margins and reinforce Thermo Fisher's market-leading positioning across the scientific equipment and life sciences landscape.
Institutional portfolio adjustments and positive equity research coverage have also contributed to the upward momentum and trading activity. Recent regulatory filings revealed fresh position building by institutional managers and hedge funds, reflecting strong confidence in the company's steady earnings power and recurring cash flows. Analysts maintain a predominantly bullish consensus rating, pointing to the underlying strength of the broad biopharma end-market and the successful integration of recent acquisitions. While broader market volatility and executive insider sales under pre-arranged trading plans created intraday fluctuations, the overarching sentiment remains anchored by Thermo Fisher's improving end-market demand and sound execution.
Technical Analysis of Thermo Fisher Scientific Inc (TMO)
Technically, Thermo Fisher Scientific Inc (TMO) shows a MACD (12,26,9) value of -4.102, indicating a neutral signal. The RSI at 62.396 suggests neutral condition and the Williams %R at 38.226 suggests buy condition. Please monitor closely.
Media Coverage of Thermo Fisher Scientific Inc (TMO)
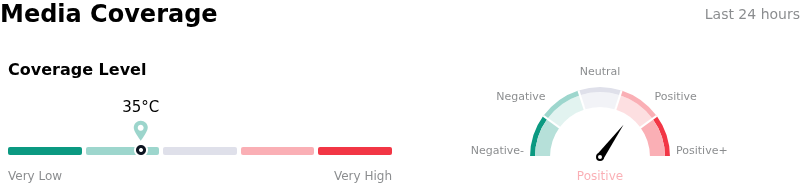
In terms of media coverage, Thermo Fisher Scientific Inc (TMO) shows a coverage score of 35, indicating a low level of media attention. The overall market sentiment index is currently in bullish zone.
Fundamental Analysis of Thermo Fisher Scientific Inc (TMO)
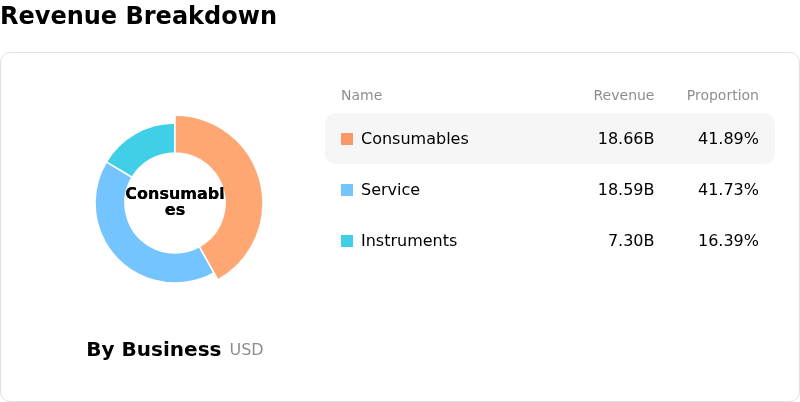
Thermo Fisher Scientific Inc (TMO) is in the Healthcare Services & Equipment industry. Its latest annual revenue is $44.56B, ranking 2 in the industry. The net profit is $6.70B, ranking 1 in the industry. Company Profile
Over the past month, multiple analysts have rated the company as Buy, with an average price target of $638.06, a high of $750.00, and a low of $540.00.
More details about Thermo Fisher Scientific Inc (TMO)
Company Specific Risks:
- Sluggish Organic Growth and Margin Compression: Recent Wall Street commentary highlights that recent top-line expansion relies heavily on M&A rather than organic volume, while declining multi-year operating margins reflect persistent operational cost pressures across core diagnostic segments.
- Expanding Debt Burden and Reduced Cash Reserves: SEC disclosures detail an increase in long-term debt to approximately $39.18 billion alongside a substantial drawdown in cash reserves to $4.06 billion following major acquisitions, elevating balance sheet leverage and tightening short-term liquidity.
- Protracted Headwinds in Government and Academic End-Markets: Ongoing industry commentary indicates delayed budget recoveries and spending restraint across U.S. academic and government research institutions, creating top-line friction for the analytical instruments and bioprocessing divisions.
- Insider Equity Sales at Valuation Resistance: Recent Form 4 and Form 144 filings disclose notable share divestments by executive officers, signaling management caution as the stock trades near analyst fair-value target caps.
Recommended Articles


