


Netflix Inc Stock (NFLX) Moved Up by 3.56% on Aug 19: What Investors Need To Know
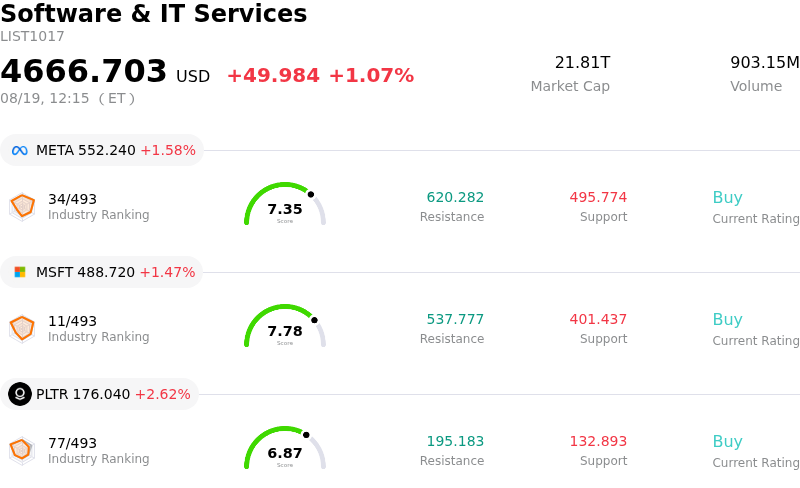
Netflix Inc (NFLX) moved up by 3.56%. The Software & IT Services sector is up by 1.07%. The company outperformed the industry. Top 3 stocks by turnover in the sector: Meta Platforms Inc (META) up 1.52%; Microsoft Corp (MSFT) up 1.47%; Palantir Technologies Inc (PLTR) up 2.62%.
What is driving Netflix Inc (NFLX)’s stock price up today?
Netflix experienced positive upward price action as momentum built following high-profile institutional accumulation disclosures. Bill Ackman's Pershing Square revealed a new stake in the streaming giant in recent portfolio filings, signaling strong institutional endorsement. Pershing Square highlighted Netflix's dominant global market position, citing its expanding subscriber base and superior competitive moat relative to traditional legacy media competitors. This vote of confidence from prominent hedge fund backing helped catalyze fresh buying interest and improve broader investor sentiment.
Beyond institutional positioning, operational updates around Netflix's advertising platform provided fundamental support. The company reported significant progress in its upfront advertising commitments, nearly doubling ad sales commitments relative to the prior year. Expanded live programming slates—including high-profile sports partnerships—have substantially boosted advertiser demand and unlocked higher-margin monetization opportunities. Enhanced ad-tech capabilities, coupled with the success of its low-cost ad tier, continue to widen subscriber acquisition while diversifying corporate revenue streams beyond membership fees alone.
From a balance sheet and strategy perspective, capital allocation discipline further reassured the market. Robust free cash flow generation, controlled content spending, and active share repurchase activity have fortified financial stability. Following a broader retreat in growth stocks, the stock appeared increasingly attractive on long-term discounted cash flow and valuation metrics, encouraging value-oriented investors to rebuild positions as confidence in long-term earnings expansion takes hold.
Technical Analysis of Netflix Inc (NFLX)
Technically, Netflix Inc (NFLX) shows a MACD (12,26,9) value of 1.392, indicating a buy signal. The RSI at 58.734 suggests neutral condition and the Williams %R at 15.528 suggests overbought condition. Please monitor closely.
Media Coverage of Netflix Inc (NFLX)
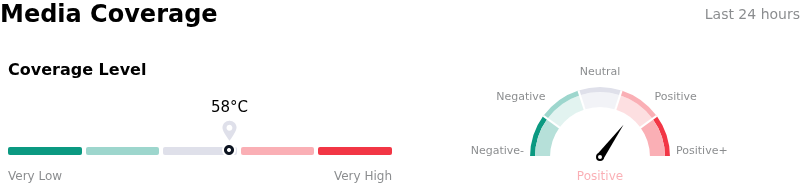
In terms of media coverage, Netflix Inc (NFLX) shows a coverage score of 58, indicating a moderate level of media attention. The overall market sentiment index is currently in bullish zone.
Fundamental Analysis of Netflix Inc (NFLX)
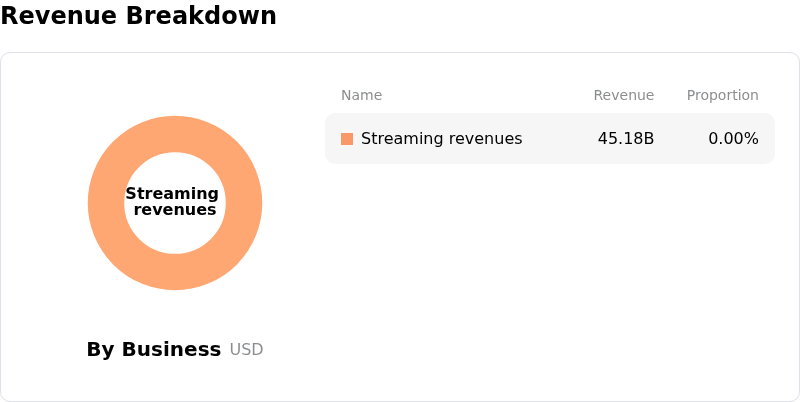
Netflix Inc (NFLX) is in the Software & IT Services industry. Its latest annual revenue is $45.18B, ranking 12 in the industry. The net profit is $10.98B, ranking 10 in the industry. Company Profile
Over the past month, multiple analysts have rated the company as Buy, with an average price target of $96.29, a high of $150.00, and a low of $70.00.
More details about Netflix Inc (NFLX)
Company Specific Risks:
- Top-Line Growth Deceleration: Recent analyst commentary highlights cooling revenue growth of 13.4% year-over-year in Q2 with Q3 guidance slowing further to 11.7%, driving institutional downgrades and compressing valuation multiples as the market re-rates the business.
- Advertising Tier Monetization Pressure: Decelerating core subscription growth has increased reliance on the ad-supported tier, where execution risks and slower monetization rates leave near-term financial projections vulnerable to downside.
- Inefficient Live Content Spending: Institutional analysis raised capital allocation concerns over management directing 5% of the 2026 content budget toward live programming and sports, despite these formats generating only 1% of total subscriber viewing hours.
- Executive Insider Share Dispositions: SEC Form 4 and Form 144 filings disclose ongoing open-market share sales by key executives, including CFO Spencer Neumann selling 9,248 shares and Co-CEO Gregory Peters selling 27,312 shares, generating technical selling pressure.
Recommended Articles


