


Natural Gas - Futures (NATGAS-F) Is down 2.07% on Aug 17: What Is Driving the Move?
Natural Gas - Futures (NATGAS-F) is down 2.07% at Aug 17 01:35(ET), now at $2.651, with a 7-day down of 4.30%.
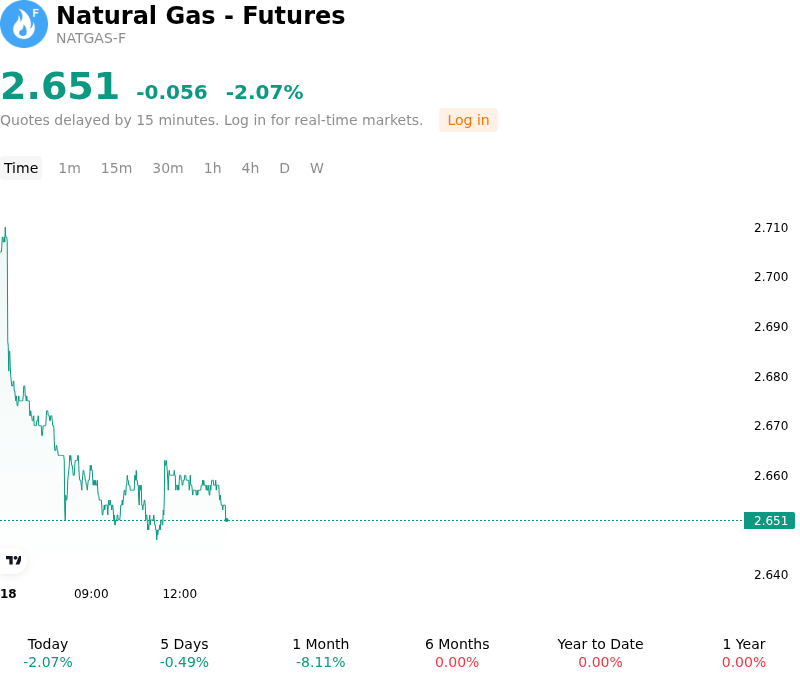
What is driving Natural Gas - Futures (NATGAS-F)’s stock price down today?
U.S. natural gas futures experienced notable downside pressure as robust domestic production and elevated storage inventories continued to weigh heavily on market sentiment. Dry gas output across the Lower 48 states has hovered near record levels, driven by strong associated gas production in major shale basins and unconstrained pipeline flows. Concurrently, recent storage injection reports revealed larger-than-expected builds relative to historical five-year averages, keeping overall U.S. working gas inventories comfortably above seasonal norms. This expanding supply cushion has reinforced expectations of a well-supplied market entering the late-summer injection period, diminishing immediate bullish catalysts for Henry Hub prompt-month contracts.
Demand-side fundamentals provided little relief to offset the relentless supply expansion. Feedgas flows to major domestic liquefied natural gas export facilities saw a subtle reduction, keeping additional gas trapped within regional market hubs and boosting localized storage accumulation. Although persistent summer heat across southern and western regions maintained firm natural gas burn from electric utilities for cooling demand, institutional investors assessed that power generation loads were inadequate to absorb current production volumes. The structural surplus has thus prevented heat-related demand rallies from sustaining momentum.
From a market positioning standpoint, institutional capital flows reflect growing caution over end-of-season storage capacity constraints. With total inventory levels projected to reach multi-year highs before the start of the winter heating season, funds have favored short positioning and technical selling on temporary price bounces. Moving forward, market participants will closely monitor potential tropical storm activity in the Gulf Coast that could disrupt LNG operations, seasonal pipeline maintenance schedules, and any signs of upstream producer curtailments aimed at rebalancing the market ahead of the autumn shoulder season.
Technical Analysis of Natural Gas - Futures (NATGAS-F)
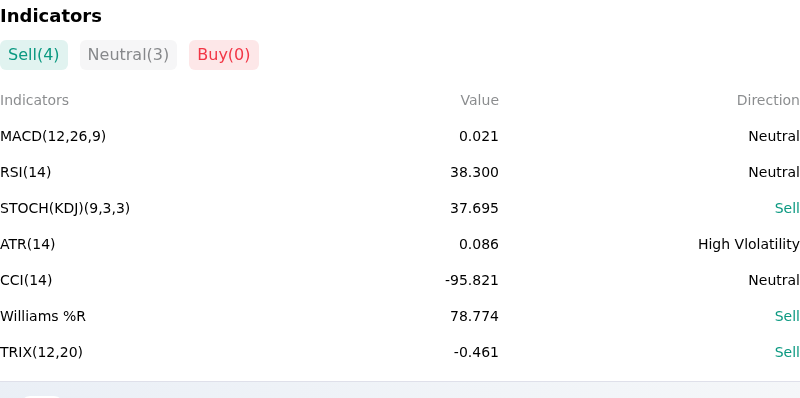
Technically, Natural Gas - Futures (NATGAS-F) shows a MACD (12,26,9) value of 0.021, indicating a neutral signal. The RSI at 38.300 suggests neutral condition and the Williams %R at 78.774 suggests sell condition. Please monitor closely.
More details about Natural Gas - Futures (NATGAS-F)
Recent Events and Risks:
- Record Domestic Production Surge: Lower 48 dry gas production reached record levels averaging 111.3 Bcf/d in August, driven by heavy associated gas output in the Permian Basin and sustained output in the Haynesville, creating a severe physical oversupply that caps price recoveries and exposes futures to intraday sell-offs.
- Expanding Underground Storage Surplus: The latest EIA weekly inventory report revealed a larger-than-expected 36 Bcf storage injection, pushing total stockpiles to 3,153 Bcf—widening the surplus to 198 Bcf (6.7%) above the five-year norm and raising concerns that pre-winter inventories could reach a 10-year high near 3,985 Bcf by October.
- Curtailed LNG Feedgas Intake: Net gas deliveries to major U.S. LNG export facilities dropped to 17.1 Bcf/d amid seasonal maintenance and facility throttling, reducing export demand and forcing substantial excess volumes back into domestic pipeline networks and underground storage.
- Infrastructure Inflows and Seasonal Demand Fade: Midstream capacity additions, including the full 1.5 Bcf/d operation of Energy Transfer's Hugh Brinson pipeline scheduled for September 1, threaten to channel massive Permian volumes directly to Henry Hub just as peak summer air-conditioning demand begins to roll off before winter heating season begins.
Recommended Articles


