


AUD/USD (AUDUSD) Volatility Intensified on Aug 17: Factors to Watch
AUD/USD (AUDUSD) is up 0.53% at Aug 17 02:55(ET), now at $0.7119, with a 7-day up of 0.94%.
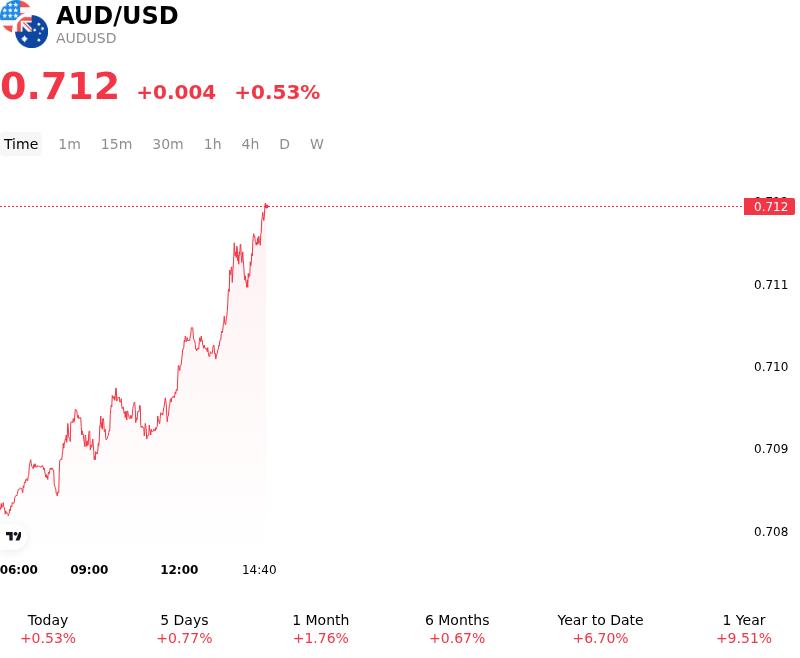
What is driving AUD/USD (AUDUSD)’s stock price up today?
The advance in AUD/USD was primarily driven by a widening divergence in monetary policy expectations between the Federal Reserve and the Reserve Bank of Australia, alongside broad weakness in the U.S. dollar. A series of softer-than-expected U.S. macroeconomic releases, including a sharp decline in retail sales alongside subdued consumer and producer price inflation figures, reinforced market conviction that U.S. economic growth momentum is moderating. This sequence of weaker U.S. fundamental prints prompted institutional investors to scale back expectations for near-term Federal Reserve rate increases, weighing on U.S. Treasury yields and dragging the greenback toward multi-week lows against major currency peers.
Conversely, the Australian dollar derived solid fundamental support from the Reserve Bank of Australia's persistently firm policy stance. Although the RBA left its benchmark cash rate unchanged at its recent policy meeting, official communications from central bank leadership underscored that monetary policy must remain restrictive to tame lingering inflation risks. Remarks reinforcing that further policy tightening remains a distinct possibility if domestic price pressures reaccelerate prevented a dovish repricing in Australian interest-rate futures. Consequently, Australian government bond yields held near multi-week highs, narrowing rate differentials against U.S. fixed-income instruments and enhancing the relative carry appeal of the Aussie dollar.
Beyond interest-rate dynamics, an improvement in broader global risk sentiment provided additional tailwinds for the growth-sensitive currency. As expectations for aggressive Fed policy diminished, broader market volatility subsided, encouraging capital allocation into high-beta commodity currencies. From a technical perspective, the currency pair's rally gained structural traction after breaching key technical resistance near the 0.7090 to 0.7100 region, triggering momentum buying and short-covering flows. While the immediate upside momentum reflects a recalibration of short-term policy expectations, institutional market participants continue to monitor upcoming domestic labor market updates and economic activity signals from China to gauge the durability of the move.
Technical Analysis of AUD/USD (AUDUSD)
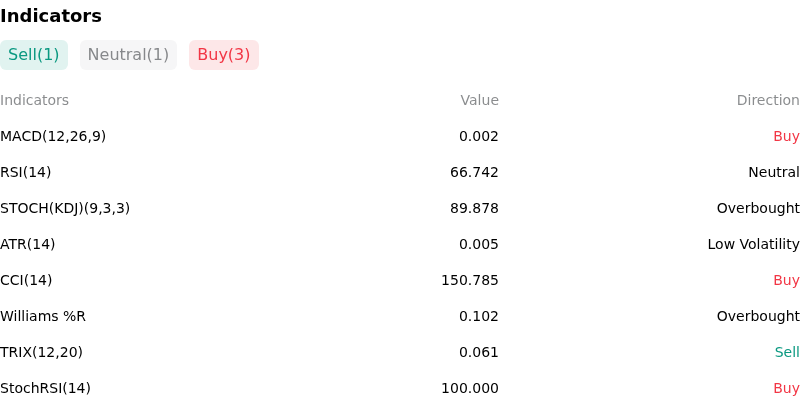
Technically, AUD/USD (AUDUSD) shows a MACD (12,26,9) value of 0.002, indicating a buy signal. The RSI at 66.651 suggests neutral condition and the Williams %R at 0.204 suggests overbought condition. Please monitor closely.
More details about AUD/USD (AUDUSD)
Recent Events and Risks:
- Domestic Policy Shift and Soft Macro Data: Signals from Reserve Bank of Australia officials indicating that monetary policy tightening is effectively slowing aggregate demand and housing activity, alongside cooling underlying inflation, have curbed expectations for further rate hikes, stripping the Aussie dollar of hawkish policy momentum.
- Technical Resistance Rejection at 0.7090–0.7100: Intraday price rejections near the key 0.7090–0.7100 technical resistance barrier have triggered profit-taking, leaving the pair vulnerable to corrective selling toward support levels near 0.7050 and 0.7030.
- Geopolitical Risk and Dampened Risk Appetite: Ongoing Middle East geopolitical friction and elevated energy prices continue to weigh on global risk-on sentiment, driving defensive flows into liquidity havens and pressuring high-beta risk currencies such as the Australian dollar.
- China Economic Uncertainty and Commodity Exposure: Mixed economic recovery signals from China's industrial and property sectors, alongside soft iron ore prices, pose a persistent threat to Australia's trade outlook and downside sentiment for AUD/USD.
Recommended Articles


