


Solana (SOLUSD) Volatility Intensified on Aug 17: What You Should Know
Solana (SOLUSD) is up 1.18% at Aug 17 02:50(ET), now at $74.91, with a 7-day down of 0.69%.
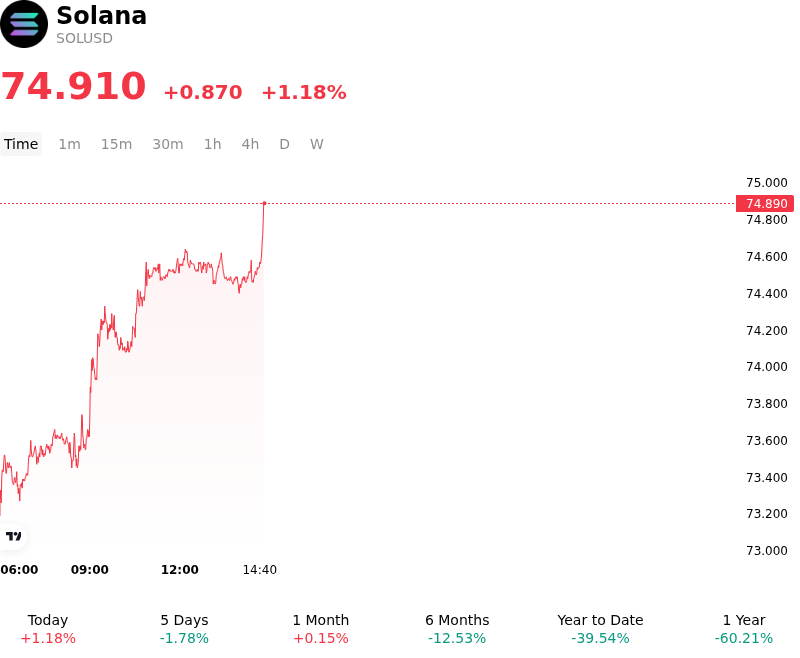
What is driving Solana (SOLUSD)’s stock price up today?
Capital flowed into Solana as market sentiment improved following key technical and institutional developments that bolstered the network's long-term utility narrative. Primary among these catalysts was the mainnet activation of the Agave v4.2 client upgrade, which substantially reduced on-chain rent costs for developers while expanding maximum transaction limits. By lowering data storage expenses by approximately ninety percent, the upgrade significantly enhances application economics, positioning the network for scalable decentralized application growth and serving as a key milestone ahead of future consensus enhancements. This technical progress was matched by institutional demand reflected in sustained net inflows into spot Solana exchange-traded products, particularly funds like Bitwise's BSOL, underscoring persistent institutional allocation to the asset despite broader market consolidation.
On-chain fundamentals further supported the upward price action, driven by rapid momentum across Solana's real-world asset ecosystem. Recent network data showed Solana leading all public blockchains in monthly net inflows for tokenized U.S. Treasuries, driving the network's total distributed real-world asset valuation to record levels. Institutional integration was additionally reinforced by major enterprise rollouts, such as MoneyGram's launch of cash ramp services across its global network and expanded tokenized equity offerings on-chain. These developments highlight accelerating capital migration onto Solana's high-throughput infrastructure, improving liquidity conditions and validating its position as a primary settlement layer for tokenized financial assets.
From a liquidity and positioning perspective, the move reflected institutional capital rotation amidst mixed broader cryptocurrency market dynamics. As major benchmark digital assets experienced temporary consolidation, institutional investors reallocated risk capital into foundational Layer-1 protocols with clear adoption catalysts. In the derivatives market, short covering and open interest adjustments contributed to intraday upside momentum, while governance discussions surrounding enhanced token disinflation schedules bolstered long-term scarcity expectations. Although broader macroeconomic risks, including central bank policy trajectories and systemic liquidity shifts, remain key variables for risk assets, Solana's current trajectory continues to be supported by improving network efficiency and expanding institutional participation.
Technical Analysis of Solana (SOLUSD)
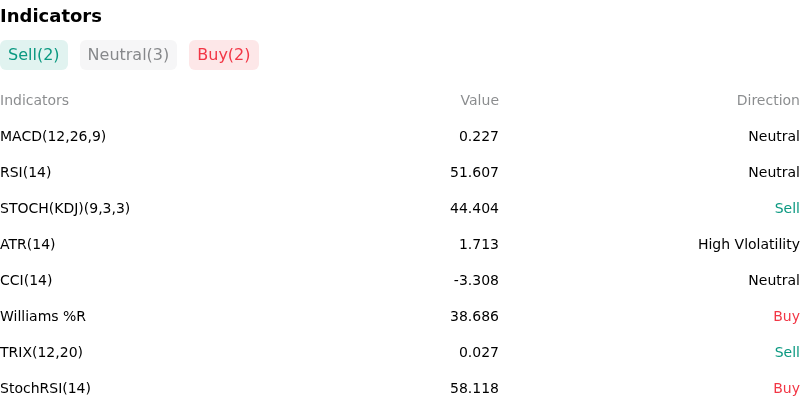
Technically, Solana (SOLUSD) shows a MACD (12,26,9) value of 0.227, indicating a neutral signal. The RSI at 51.607 suggests neutral condition and the Williams %R at 38.686 suggests buy condition. Please monitor closely.
More details about Solana (SOLUSD)
Recent Events and Risks:
- FTX/Alameda Unlocked Supply Overhang: Recent on-chain transfers of over 200,000 unlocked SOL from Alameda Research-linked staking addresses to custodian accounts for bankruptcy distributions have heightened market fears of spot supply overhang and near-term selling pressure.
- Overleveraged Derivatives and Long Squeeze Vulnerability: Perpetual futures open interest remains elevated with heavily skewed long positioning, leaving SOL exposed to aggressive liquidation cascades and long unwinding if price breaks below the $73.50 to $75.00 support zone amid fading spot demand.
- Validator Routing Friction and Liquidity Disruption: On-chain validator-routing issues and execution latency have prompted market makers and liquidity providers to widen bid-ask spreads, increasing intraday execution risk and price volatility ahead of the Agave network upgrade rollout.
- Macro Risk-Off Drag and Regulatory Uncertainty: Broader digital asset weakness—driven by SEC regulatory meeting cancellations and persistent macroeconomic interest rate headwinds—continues to suppress high-beta Layer-1 tokens, keeping SOL constrained beneath its major moving average resistance levels.
Recommended Articles


