

Pepe Price Forecast: Pepe defends a key support amid mixed retail demand

Source Fxstreet
  • Pepe is up nearly 2% on Monday, following a 10% decline last week.
  • Retail strength remains mixed as PEPE Open Interest wanes but funding rates flip positive.
  • Pepe’s technical outlook is mixed as price holds above a crucial support level amid steady downside pressure.

Pepe (PEPE) is up nearly 2% on Monday after a 10% decline last week, showing signs of a mild recovery, while broader crypto market risk appetite remains weak. PEPE derivatives data point to a mixed outlook, as Open Interest declines while funding rates turn positive. Technically, PEPE must hold above its $0.00000255 support floor to avoid a downside of over 10%. 

PEPE retail strength in a limbo

Pepe shows early signs of renewed retail strength, which could support its mild intraday recovery. CoinGlass data shows the PEPE futures Open Interest is down roughly 3% over the last 24 hours, contracting the notional value of active contracts to $192.99 million. Liquidation data points to a primarily bullish positional wipeout in the same time period, with long liquidations of $345,100 and short liquidations of $37,980. Taken together, PEPE derivatives indicate that long-side positional buildup faces a higher risk of liquidation.

Still, the funding rate is up to 0.0017%, from -0.0100% the previous day, suggesting renewed buying pressure in long positions as traders anticipate reduced downside or a potential rebound.
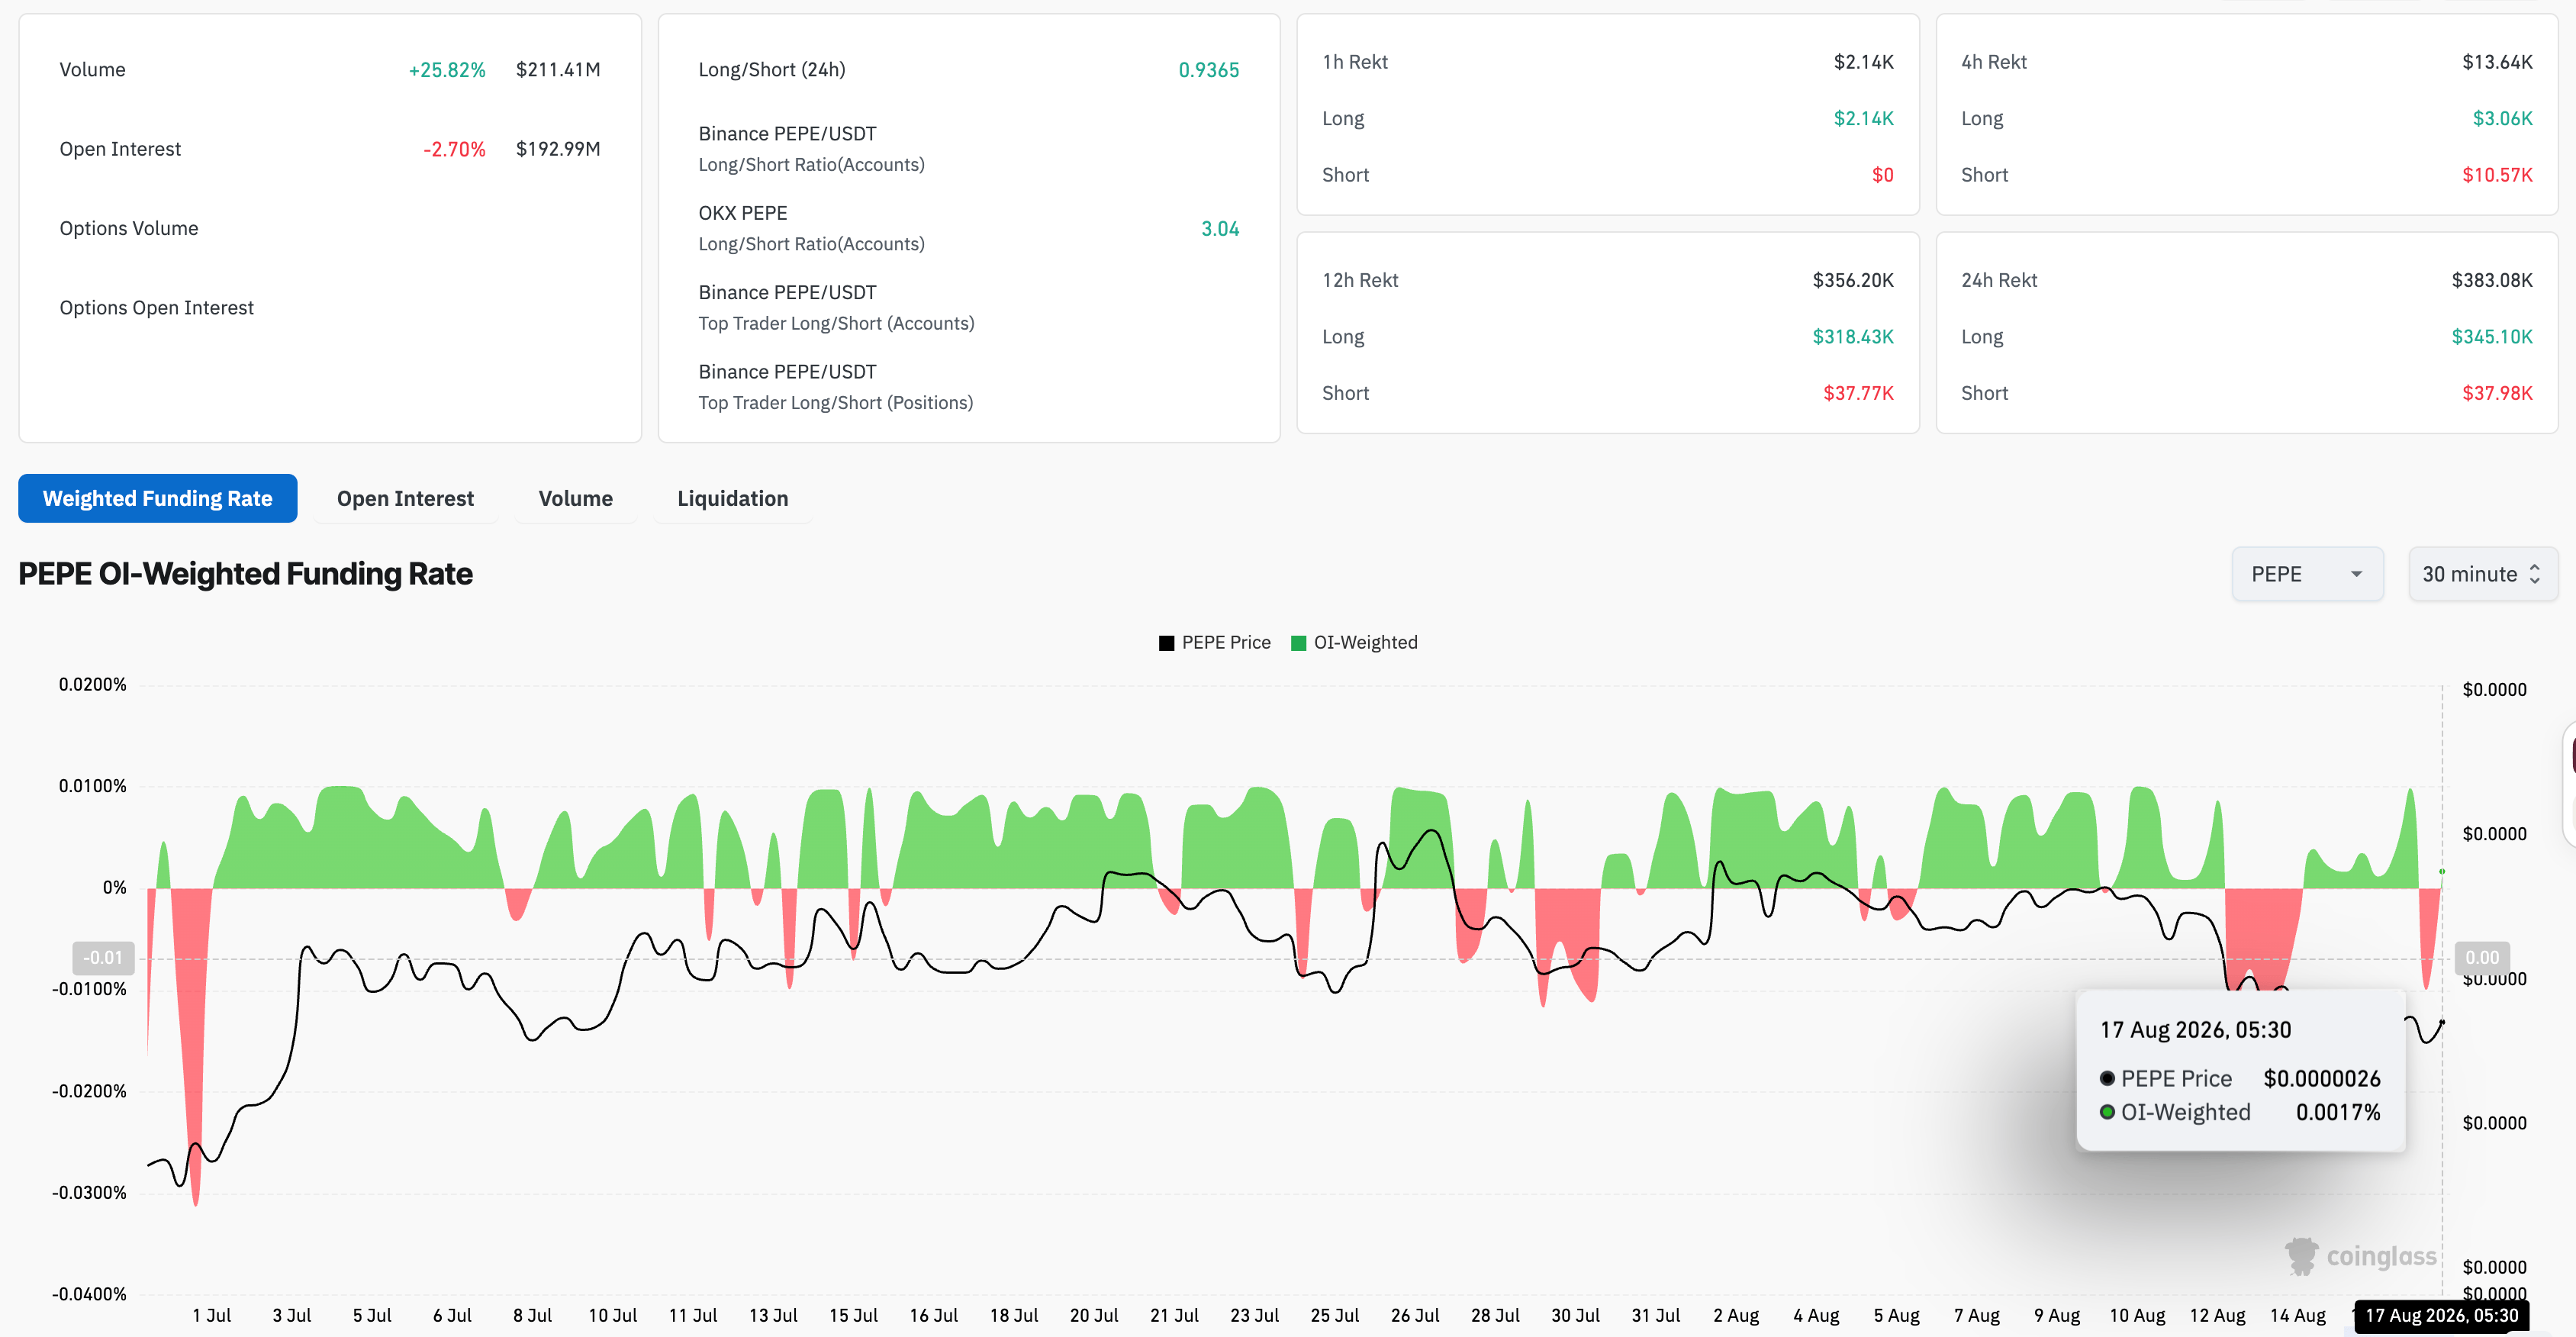
PEPE derivatives data. Source: CoinGlass

Technical outlook: Will PEPE bounce back?

Pepe edges higher at press time on Monday, following a 10% rebound last week. The meme coin is holding ground at a crucial support level of $0.00000255, marked by the July 8 low. The mild recovery in Pepe hints at early signs of a potential rebound, extending the consolidation capped by the June 15 high at $0.00000314.

Momentum on the daily chart remains weak, with the relative strength index (RSI) at 39, indicating persistent downside pressure but not yet in oversold territory. Meanwhile, the moving average convergence divergence (MACD) extends a declining trend below the zero line, with a negative histogram expanding, reaffirming the bearish bias.
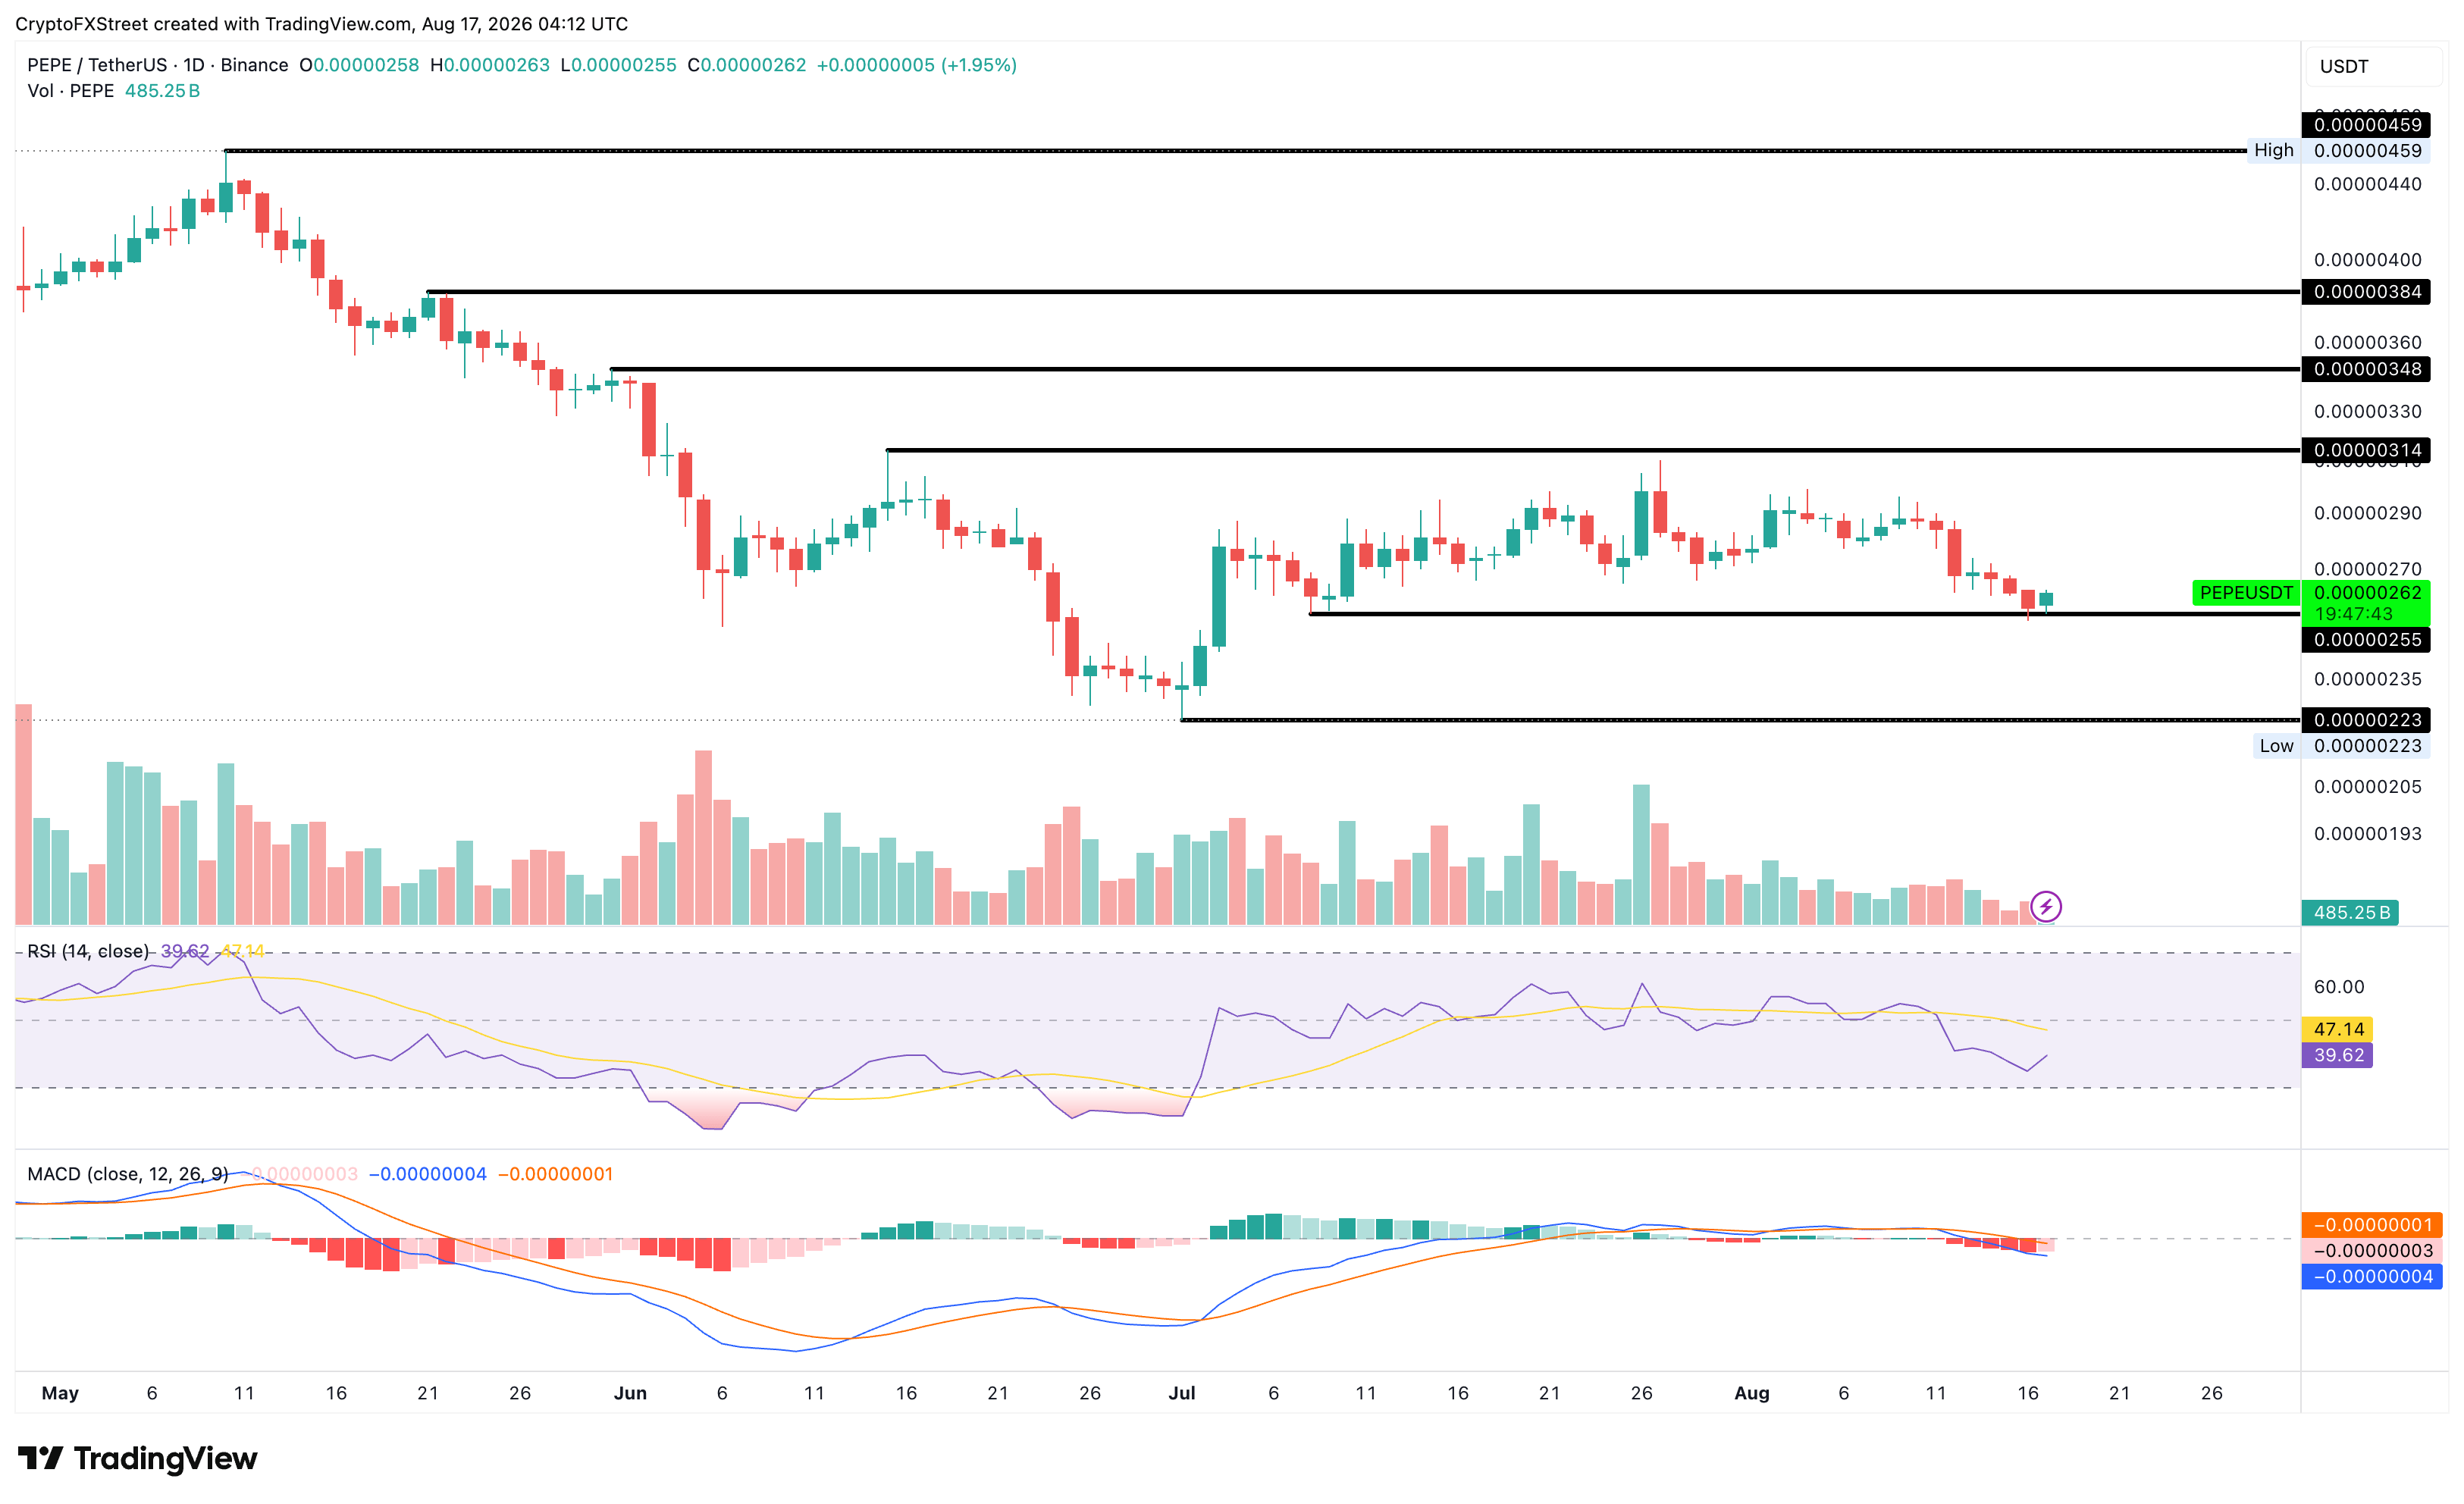
PEPE/USDT daily price chart.

Looking down, a daily close below the $0.00000255 support level could nullify the rebound chances and extend the decline toward the July 1 low at $0.00000223, hinting at a downside of over 10%.

(The technical analysis of this story was written with the help of an AI tool. Know more.)

Disclaimer: For information purposes only. Past performance is not indicative of future results.
placeholder
XRP Price Prediction for July 2026: Can Buyers Finally Break the Downtrend?XRP (XRP) price trades near $1.05, caught between a year-long downtrend and a sudden burst of buying.July has historically rewarded XRP holders. This year the month arrives with on-chain accumulation
Author  Beincrypto
Jun 30, Tue
XRP (XRP) price trades near $1.05, caught between a year-long downtrend and a sudden burst of buying.July has historically rewarded XRP holders. This year the month arrives with on-chain accumulation
placeholder
What to Expect From Ethereum (ETH) in July 2026Ethereum (ETH) enters July 2026 trading near $1,570, close to multi-month lows, after recording its first run of three consecutive red quarterly candles in its history.On-chain data and price charts n
Author  Beincrypto
Jul 01, Wed
Ethereum (ETH) enters July 2026 trading near $1,570, close to multi-month lows, after recording its first run of three consecutive red quarterly candles in its history.On-chain data and price charts n
placeholder
Today’s Market Recap: Chip Stocks Retreat Collectively, Meta Rises Against the Trend, Non-Farm Payrolls Become the Next Key CatalystOn July 1, Eastern Time, U.S. stocks closed fluctuating lower on the first trading day of the second half of the year. Although some megacap tech stocks such as Meta (
Author  TradingKey
Jul 02, Thu
On July 1, Eastern Time, U.S. stocks closed fluctuating lower on the first trading day of the second half of the year. Although some megacap tech stocks such as Meta (
placeholder
XAUUSD Gold Analysis: Gold Holds Above $4,350 Ahead of US Inflation Data Is $4,500 Next? Gold holds above $4,350 following weak US jobs data. As inflation reports approach and UBS eyes $5,000, can XAUUSD break resistance at $4,435 to rally toward $4,500?
Author  Naoufal Seddik
Aug 12, Wed
Gold holds above $4,350 following weak US jobs data. As inflation reports approach and UBS eyes $5,000, can XAUUSD break resistance at $4,435 to rally toward $4,500?
placeholder
Gold Price Analysis Today: Gold Drops 1.32% Despite Lower Fed Rate-Hike Bets, Can $4,313 Support Hold? Gold fell 1.32% on August 13 after rising to $4,449.73, then reversing lower and closing near $4,349.918 below the $4,356.46 support. Softer US inflation data reduced Fed rate hike expectations, but selling pressure still dominated the session. Will $4,313 support hold?
Author  Naoufal Seddik
Aug 14, Fri
Gold fell 1.32% on August 13 after rising to $4,449.73, then reversing lower and closing near $4,349.918 below the $4,356.46 support. Softer US inflation data reduced Fed rate hike expectations, but selling pressure still dominated the session. Will $4,313 support hold?
goTop
quote