

Zcash Price Forecast: ZEC stalls around $1,400 as easing upside momentum risks capitulation

แหล่งที่มา Fxstreet
  • Zcash hovers around $1,400 on Wednesday after three consecutive days of losses totaling about 15%.
  • Grayscale’s ZEC-focused ETFs recorded over $8 million in outflows on Monday, ahead of its 3-for-1 stock split on Wednesday.
  • The technical outlook for ZEC indicates a near-term corrective bias, targeting the $1,300 support floor.

Zcash (ZEC) price stalls around $1,400 at press time on Wednesday, holding steady after a 15% decline over the last three consecutive days of losses. Early signs of easing institutional demand, with $8 million in outflows on Monday, back the near-term downside risk in the privacy coin. The technical outlook for ZEC indicates a potential dip toward the $1,300 support floor. 

Grayscale’s ZCSH inflows flip negative ahead of stock split

Grayscale’s Zcash Trust Fund Exchange Traded Fund (ETF), ticker ZCSH, announced a 3-for-1 stock split within its first month of trading. This decision is based on the strong bullish undercurrent, with over $250 million in inflows in the first 30 days of trading, totaling $21.83 million in August and $276.17 million so far in September. 

However, the ZCSH fund recorded zero inflow on Tuesday after $8.12 million in outflows on Monday, suggesting an early sign of easing institutional demand ahead of the stock split.
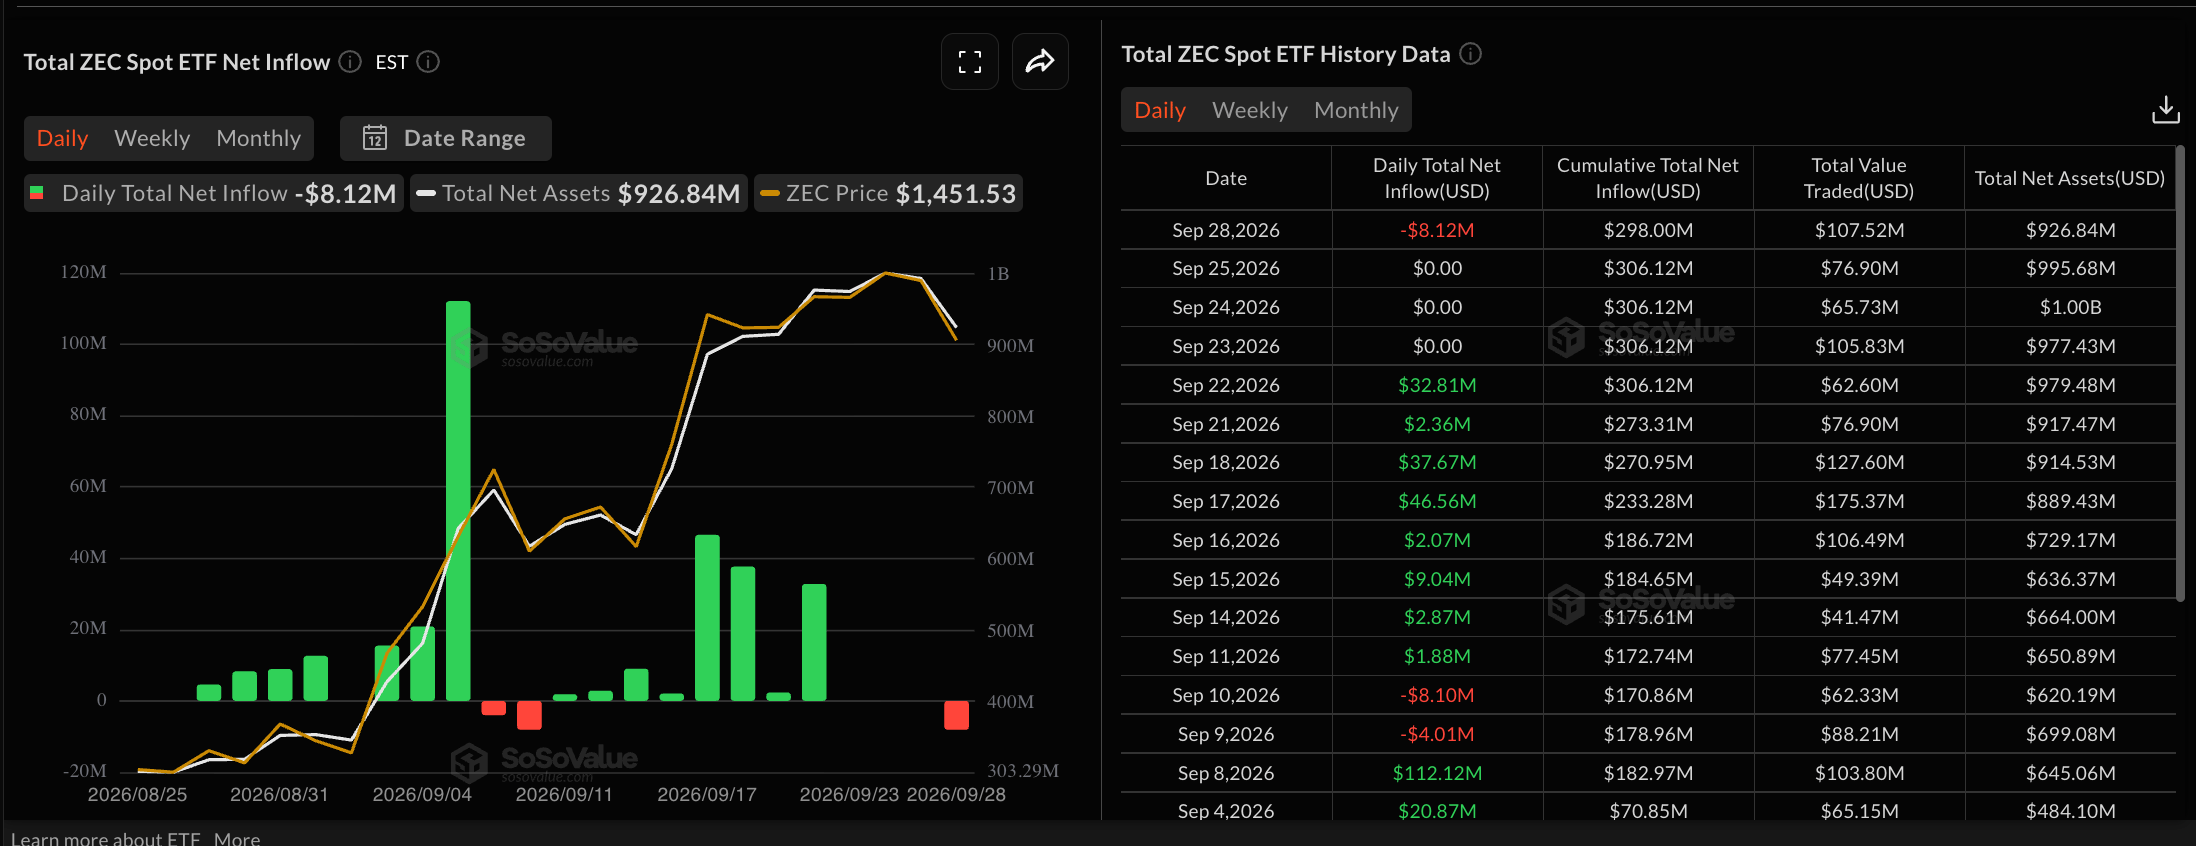
Zcash ETFs data. Source: Sosovalue

Technical outlook: Will Zcash hold above $1,300?

Zcash trades around $1,412 at press time on Wednesday, extending the pullback from Sunday's high of $1,698. The privacy coin maintains a near-term bearish bias after three consecutive days of losses totaling around 15%.

The price hovers below the 50- and 100-period Exponential Moving Averages (EMAs) on the four-hour chart at $1,494 and $1,425, respectively, while only the 200-period EMA at $1,254 underpins the broader structure. The path of least resistance targets a downside to the September 9 high at $1,296, reinforced by the 200-period EMA at $1,254, projecting a potential 10% downside risk.

The Moving Average Convergence Divergence (MACD) remains in negative territory with a bearish profile, and the Relative Strength Index (RSI) around 41 suggests subdued demand, reinforcing the risk of further downside.

Chart Analysis ZEC/USDT (Binance)
ZEC/USDT four-hour price chart.

On the topside, initial resistance aligns with the 100-period EMA at $1,425 ahead of a stronger barrier at the 50-period EMA near $1,494, where sellers could reassert control if the pair attempts a corrective bounce. A confirmed breakout above the overhead average lines could target the September 23 high at $1,679, which capped gains on Sunday.

(The technical analysis of this story was written with the help of an AI tool. Know more.)

ข้อจำกัดความรับผิดชอบ: เพื่อการอ้างอิงเท่านั้น ผลการดำเนินงานในอดีตไม่ได้บ่งบอกถึงผลลัพธ์ในอนาคต
placeholder
ทองคำถล่มแรง! สงครามอิหร่านเดือด หุ้นโลก+SET ไทยแกว่งตามแต่ยังมีโอกาสทันทุกกระแสการเงิน สรุปข่าวเด่น Forex หุ้น ทองคำ คริปโตฯ และเศรษฐกิจรอบวัน วิเคราะห์แนวโน้มตลาดด้วยข้อมูลเชิงลึก อ่านง่าย เข้าใจไว อัปเดตล่าสุดที่นี่
ผู้เขียน  Mitrade
5 เดือน 18 วัน จันทร์
ทันทุกกระแสการเงิน สรุปข่าวเด่น Forex หุ้น ทองคำ คริปโตฯ และเศรษฐกิจรอบวัน วิเคราะห์แนวโน้มตลาดด้วยข้อมูลเชิงลึก อ่านง่าย เข้าใจไว อัปเดตล่าสุดที่นี่
placeholder
คาดการณ์ราคาโลหะเงิน: XAG/USD ร่วงลงใกล้ระดับ 60.50 ดอลลาร์ ท่ามกลางราคาน้ำมันและอัตราผลตอบแทนพันธบัตรรัฐบาลที่พุ่งขึ้นราคาโลหะเงิน (XAG/USD) ยังคงปรับตัวลดลง หลังจากร่วงลงกว่า 5% ในวันก่อนหน้า โดยซื้อขายอยู่ที่ประมาณ $60.60 ต่อทรอยออนซ์ในช่วงเวลาซื้อขายตลาดเอเชียวันอังคาร ราคาโลหะเงินซึ่งไม่มีผลตอบแทนปรับตัวลดลง เนื่องจากความไม่แน่นอนอย่างต่อเนื่องเกี่ยวกับการเจรจาระหว่างสหรัฐฯ และอิหร่านยังคงหนุนให้ราคาน้ำมันอยู่ในระดับสูง
ผู้เขียน  FXStreet
9 เดือน 29 วัน อังคาร
ราคาโลหะเงิน (XAG/USD) ยังคงปรับตัวลดลง หลังจากร่วงลงกว่า 5% ในวันก่อนหน้า โดยซื้อขายอยู่ที่ประมาณ $60.60 ต่อทรอยออนซ์ในช่วงเวลาซื้อขายตลาดเอเชียวันอังคาร ราคาโลหะเงินซึ่งไม่มีผลตอบแทนปรับตัวลดลง เนื่องจากความไม่แน่นอนอย่างต่อเนื่องเกี่ยวกับการเจรจาระหว่างสหรัฐฯ และอิหร่านยังคงหนุนให้ราคาน้ำมันอยู่ในระดับสูง
placeholder
แนวโน้มราคาทองคำ: ทองคำดิ่งลงสู่ระดับต่ำสุดในรอบ 7 สัปดาห์ ระดับ $4,100 จะรับอยู่หรือไม่? ราคาทองคำสปอต (XAUUSD) ดิ่งลง 4% ในวันจันทร์ โดยปิดที่ระดับ 4,114.93 ดอลลาร์ต่อออนซ์ และทำจุดต่ำสุดระหว่างวันที่ 4,110.80 ดอลลาร์ ซึ่งเป็นระดับต่ำสุดนับตั้งแต่วันที่ 5 สิงหาคม ขณะเข้าสู่ช
ผู้เขียน  TradingKey
9 เดือน 29 วัน อังคาร
ราคาทองคำสปอต (XAUUSD) ดิ่งลง 4% ในวันจันทร์ โดยปิดที่ระดับ 4,114.93 ดอลลาร์ต่อออนซ์ และทำจุดต่ำสุดระหว่างวันที่ 4,110.80 ดอลลาร์ ซึ่งเป็นระดับต่ำสุดนับตั้งแต่วันที่ 5 สิงหาคม ขณะเข้าสู่ช
placeholder
ทองคำดีดตัวจากระดับ 4,110 ดอลลาร์ ขณะที่การร่วงลงของราคาน้ำมันช่วยคลายแรงกดดันด้านเงินเฟ้อราคาทองคำ (XAU/USD) ปรับตัวเพิ่มขึ้นอย่างแข็งแกร่งกว่า 1.30% ในวันอังคาร แม้เจ้าหน้าที่ธนาคารกลางสหรัฐฯ (เฟด) จะแสดงความเห็นไปในทาง hawkish หลังแตะระดับต่ำสุดในรอบหลายสัปดาห์ใกล้ $4,110 เมื่อวันจันทร์ คู่ XAU/USD ซื้อขายอยู่ที่ $4,170 หลังดีดตัวขึ้นจากระดับต่ำสุดรายวันที่ $4,113.
ผู้เขียน  FXStreet
9 เดือน 30 วัน พุธ
ราคาทองคำ (XAU/USD) ปรับตัวเพิ่มขึ้นอย่างแข็งแกร่งกว่า 1.30% ในวันอังคาร แม้เจ้าหน้าที่ธนาคารกลางสหรัฐฯ (เฟด) จะแสดงความเห็นไปในทาง hawkish หลังแตะระดับต่ำสุดในรอบหลายสัปดาห์ใกล้ $4,110 เมื่อวันจันทร์ คู่ XAU/USD ซื้อขายอยู่ที่ $4,170 หลังดีดตัวขึ้นจากระดับต่ำสุดรายวันที่ $4,113.
placeholder
ทองคำปรับตัวลดลงใกล้ระดับ $4,150 เนื่องจากอัตราผลตอบแทนพันธบัตรกระทรวงการคลังสหรัฐฯ และราคาน้ำมันที่สูงขึ้น มีน้ำหนักมากกว่าอัตราเงินเฟ้อ PCE ที่ชะลอตัวลงในช่วงเช้าของตลาดลงทุนเอเชียวันพฤหัสบดี ราคาทองคำ (XAUUSD) ร่วงลงมาใกล้ $4,150 โดยถูกกดดันจากอัตราผลตอบแทนพันธบัตรรัฐบาลสหรัฐฯ ที่อยู่ในระดับสูง เทรดเดอร์รอข้อมูลการจ้างงานของสหรัฐฯ ประจำเดือนกันยายนเพื่อหาแรงผลักดันใหม่ ซึ่งจะมีการประกาศในช่วงต่อไปของวันศุกร์
ผู้เขียน  FXStreet
23 ชั่วโมงที่แล้ว
ในช่วงเช้าของตลาดลงทุนเอเชียวันพฤหัสบดี ราคาทองคำ (XAUUSD) ร่วงลงมาใกล้ $4,150 โดยถูกกดดันจากอัตราผลตอบแทนพันธบัตรรัฐบาลสหรัฐฯ ที่อยู่ในระดับสูง เทรดเดอร์รอข้อมูลการจ้างงานของสหรัฐฯ ประจำเดือนกันยายนเพื่อหาแรงผลักดันใหม่ ซึ่งจะมีการประกาศในช่วงต่อไปของวันศุกร์
goTop
quote