


Dogecoin Price Forecast: DOGE tests key 200-day EMA support as bulls seek recovery
- Dogecoin trades near the 200-day EMA at $0.092 on Tuesday; holding support could fuel a recovery.
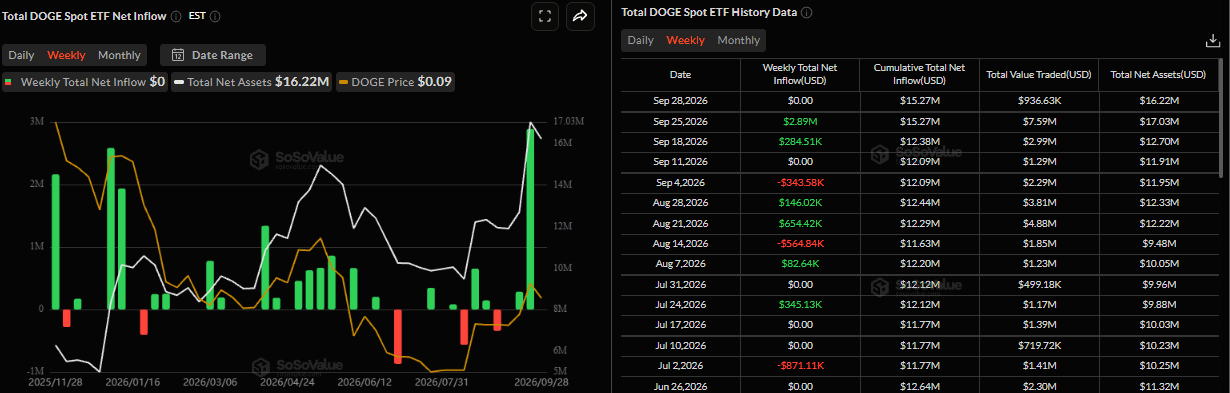
- US-listed spot ETF recorded an inflow of $2.89 million last week, marking the second consecutive week of positive flows.
- Mixed derivatives and mild whale accumulations offer limited support for DOGE.
Dogecoin (DOGE) tests a key support level near $0.092 on Tuesday, with bulls looking to prevent a deeper correction. Meanwhile, continued inflows into meme-coin spot Exchange-Traded Funds (ETFs) and whale accumulation on price dips provide some support, but mixed derivatives positioning suggests bullish momentum remains cautious.
Institutional demand holds strong
SoSoValue data showed spot ETFs recorded a $2.89 million inflow last week, marking the second straight week of inflows and indicating robust institutional demand. However, Monday’s flow remained muted; if this inflow trend continues, stays positive and intensifies through the week, DOGE could extend gains.
Derivatives traders show mixed outlook
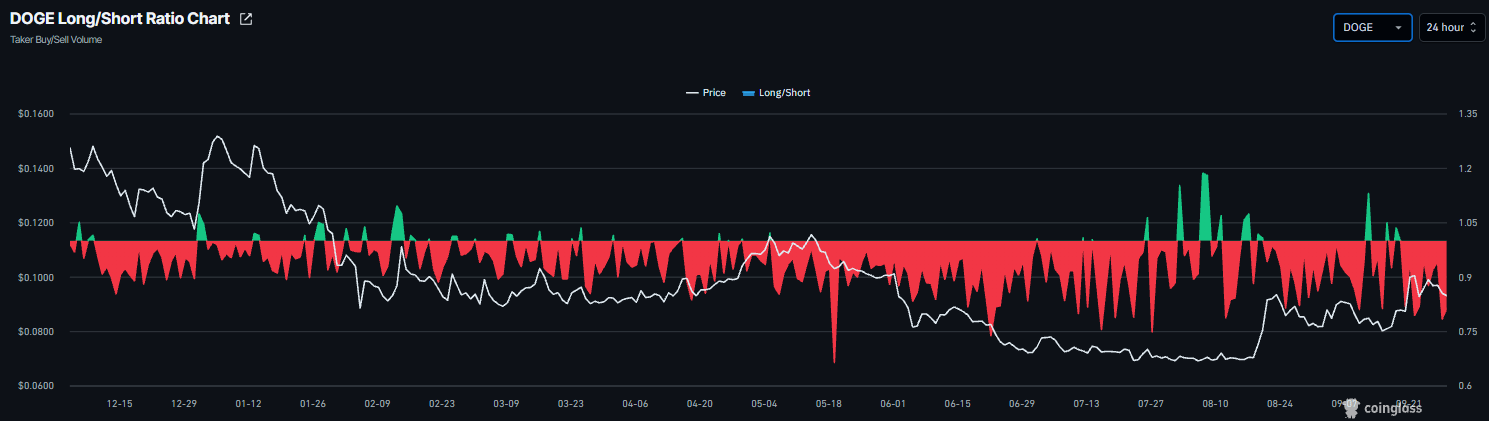
Derivatives data shows a mixed and cautious outlook among dog-themed meme coin traders. CoinGlass’ long-to-short ratio for DOGE reads 0.81 on Tuesday, nearing the lowest level over a month. A ratio below one indicates bearish sentiment, as traders bet that asset prices will fall.
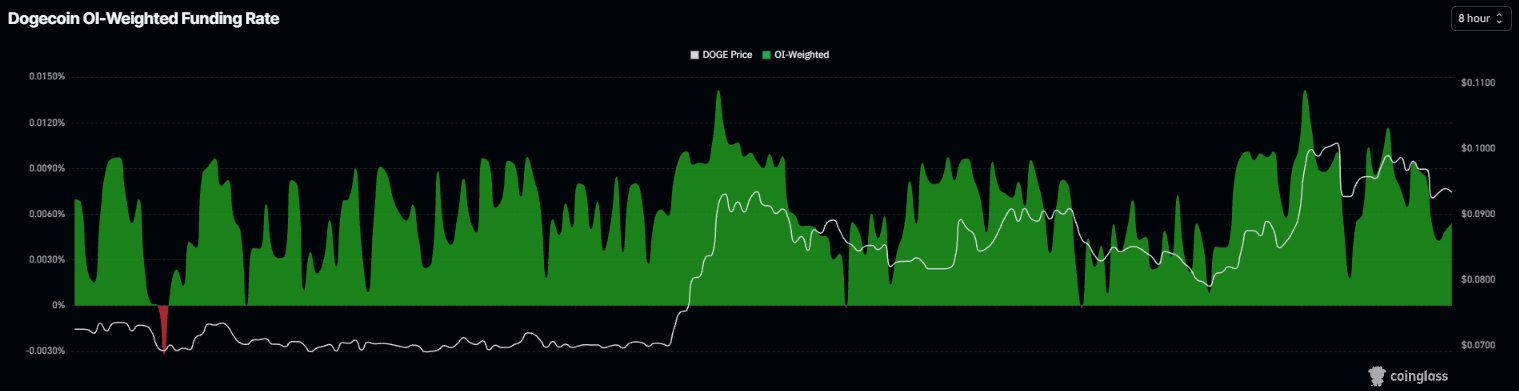
Meanwhile, Dogecoin’s funding rate flipped positive on September 10 and rose to 0.0054% on Tuesday. This indicates longs are paying shorts, reflecting a bullish outlook for Dogecoin.
This divergence suggests mixed sentiment among derivatives traders, with no clear directional conviction.
Whales buying dips
Santiment’s Supply Distribution data shows that large-wallet holders (whales) are steadily buying Dogecoin amid its recent price dips.
The metric indicates that whales holding between 100,000 and 1 million (red line), 1 million and 10 million DOGE tokens (yellow line), and 10 million and 100 million DOGE tokens (blue line) have accumulated a total of 50 million DOGE tokens since Sunday. This buy-the-dip scenario signals continued long-term interest among wallet holders and supports the ongoing price rally.
 [09-1790661042116.48.20, 29 Sep, 2026].png)
Dogecoin technical outlook: Nears key 200-day EMA
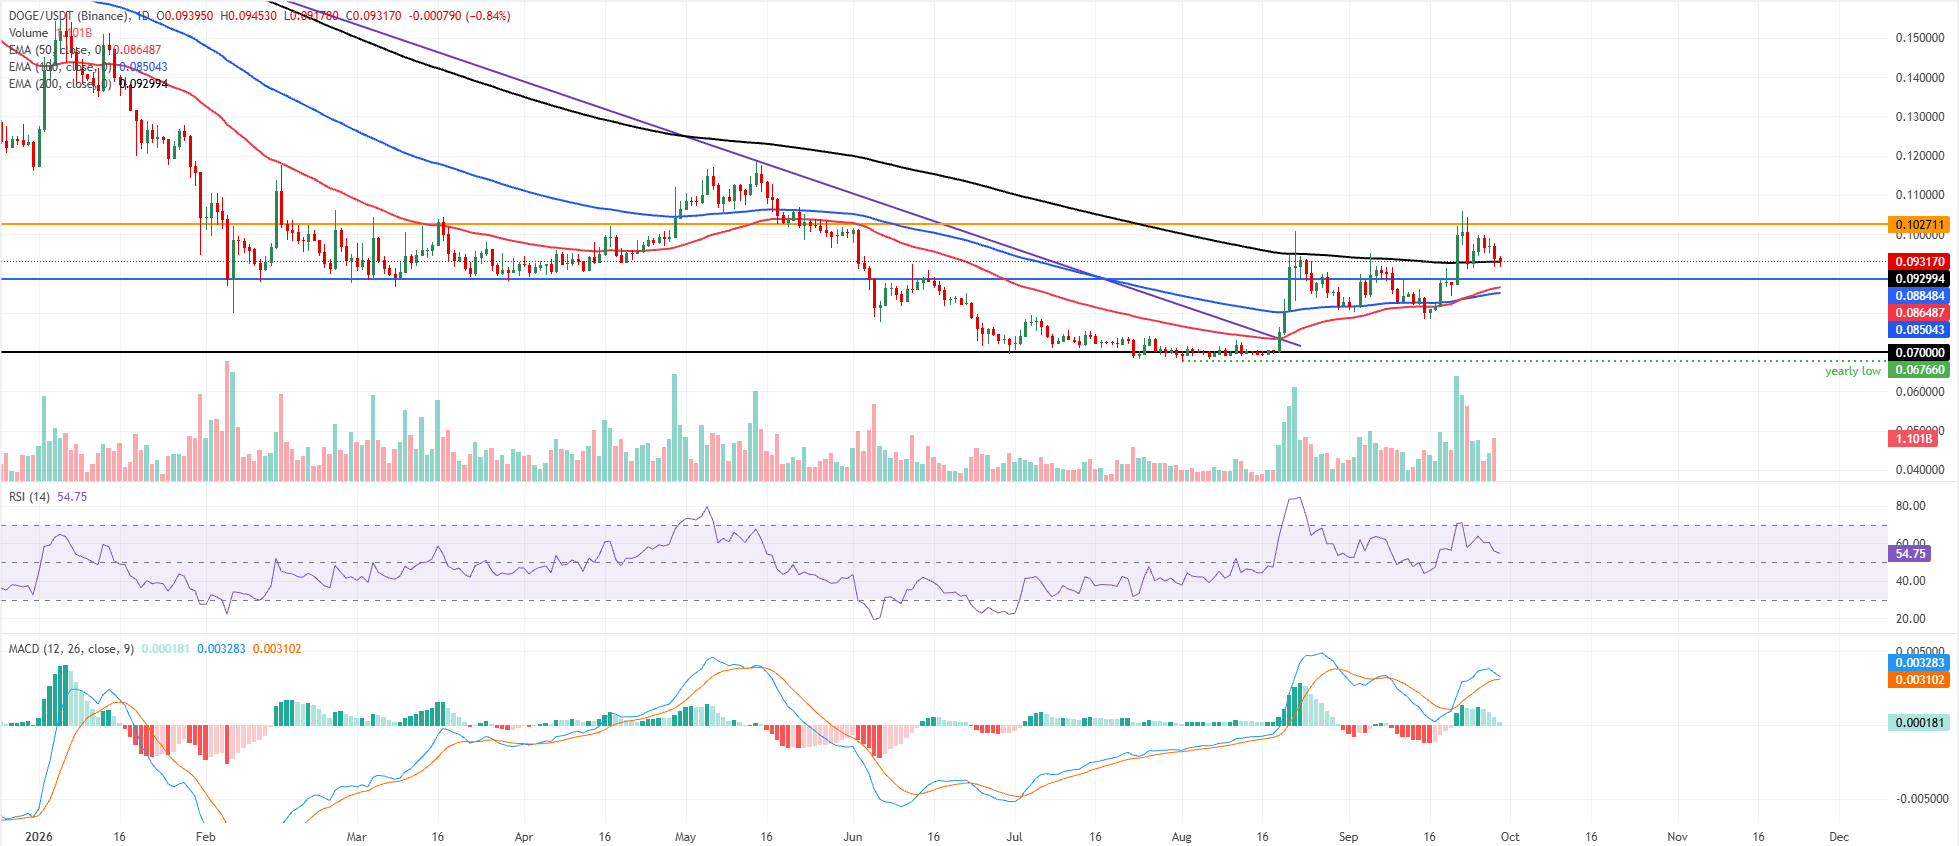
Dogecoin price trades at $0.093 on Tuesday, holding above a dense layer of moving average support and former trend resistance, which sets a mildly bullish near‑term bias. The 200-day exponential moving average (EMA) at $0.092 sits just below spot as immediate dynamic support, while the 50-day and 100-day EMAs around $0.086 and $0.085 reinforce the broader constructive tone.
DOGE also trades above the prior downward resistance trendline, whose latest interaction near $0.091 now acts as additional underlying support. Momentum stays positive but not stretched, with the Relative Strength Index (RSI) hovering around 55 and the Moving Average Convergence Divergence (MACD) indicator holding slightly in positive territory, hinting that buyers retain control without clear signs of overextension.
On the downside, initial support is seen at the 200‑day EMA near $0.092, followed by the reclaimed trendline zone around $0.091 and the horizontal shelf at $0.088. Below these, the 50‑day and 100‑day EMAs at $0.086 and $0.085, along with the deeper horizontal level at $0.070, mark subsequent demand layers should a broader pullback unfold.
On the topside, the first notable resistance is the horizontal barrier around $0.102; a daily close above would likely pave the way for a continuation of the advance and expose higher levels on the medium‑term horizon.
(The technical analysis of this story was written with the help of an AI tool. Know more.)
บทความแนะนำ


