Will IBM Be a Trillion-Dollar Stock by 2030?

Source The Motley Fool

International Business Machines (NYSE: IBM) may finally be ready for a comeback. The stock finally surpassed its all-time high from 2013 this year, and with its transformation into a cloud and artificial intelligence (AI) company, investors have taken an interest.

This has given IBM a market cap of around $205 billion. Given its trajectory, that figure will likely continue rising, so much so that some investors may speculate on whether it can become a trillion-dollar stock by 2030. While nobody knows for certain whether it can reach that level, it is likely worth taking a closer look to gauge the potential for such an occurrence.

The state of IBM

First, investors should realize that taking a $205 billion market cap to $1 trillion in six years will require an average stock price increase of 30% annually for the next six years.

In the previous decade, reaching such a goal did not appear likely. However, thanks to its metamorphosis, IBM has become a fundamentally different company over the last five years. The transformation began in earnest when Arvind Krishna, then the head of IBM's cloud and cognitive software division, spearheaded the $34 billion acquisition of Red Hat.

This purchase meant a massive increase in IBM's total debt. So large was that debt that a failure would have likely led to doubts about IBM's future.

Still, IBM seemed to believe enough in Krishna's vision that the company elevated him to the CEO role the following year, and it appears the gamble has paid off. Krishna went on to acquire numerous smaller cloud companies and spun off the managed infrastructure business into Kyndryl.

This has given IBM a 2% market share in the cloud infrastructure market, according to Synergy Research Group. While this may not sound significant, Grand View Research estimates the global cloud market will grow to $2.4 trillion by 2030. Hence, if it just maintains that percentage, that could mean a massive increase in revenue over that time.

Cloud Infrastructure Market Share, By Company, Q1 2024

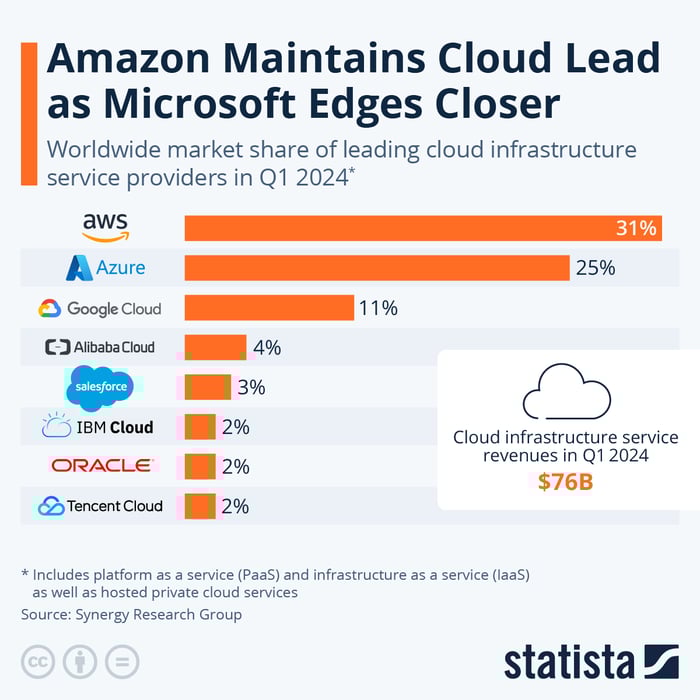
Image source: Statista.

Additionally, IBM's more prominent role in the cloud has made the company a player in the emerging generative AI market with watsonx. In the year since the company launched watsonx, IBM's book of business in generative AI has grown to more than $2 billion. Grand View Research estimates that the market will reach $109 billion by 2030, a compound annual growth rate (CAGR) of 37%. This could bode well for IBM's generative AI platform if it can come close to matching this growth.

This is not to say that IBM has become only a cloud and AI company. Just over half of its revenue comes from its consulting and infrastructure segments. However, the largest segment remains software, which plays a critical role in the modern tech industry.

IBM's financials

Unfortunately, the company's overall growth rate may leave investors questioning whether it can reach a $1 trillion market cap in the next six years.

In the first half of 2024, revenue was just over $30 billion, and it rose just 2% from year-ago levels. Software, which made up 42% of overall revenue, increased by merely 6%. Consulting and infrastructure, which are nearly all of the remaining revenue, did not experience significant increases.

Still, its net income for the first two quarters of 2024 was $3.4 billion, a 37% yearly increase. An income tax benefit of $112 million (compared with a $543 million tax payment in the first half of 2023) gave IBM a critical break on income taxes, allowing the company's profit to rise significantly.

Unfortunately, that benefit is unlikely to repeat in future years. While IBM raised revenue growth guidance to mid-single-digits for the year, it may not be enough to inspire a rapid increase in the stock price.

Moreover, the stock price has risen by almost 60% over the last year, taking its stock price to its aforementioned record high. That brings its P/E ratio to the 25 range. While that might appear reasonable, IBM has not typically seen higher valuations except in times of falling profits. This may not bode well for its prospects for rapid growth.

Will IBM be a $1 trillion stock by 2030?

Given the current trajectory of IBM's financials, a $1 trillion market cap over the next six years appears unlikely.

Despite that modest prediction, IBM is back in action -- at least from a technical perspective. Thanks to its cloud presence and watsonx, it is again a major force in the tech industry, and that bodes well for the stock.

Nonetheless, even with revenue increases rising to the mid-single-digits, it may experience slower growth than some of its industry peers.

Additionally, the income tax benefit that ignited the 37% net income growth is a one-time event. With profitability likely to backslide once income tax payments resume, IBM is probably going to struggle to generate the profit growth needed to reach $1 trillion in the next six years. Big Blue's investors should set their sights a little lower.

Should you invest $1,000 in International Business Machines right now?

Before you buy stock in International Business Machines, consider this:

The Motley Fool Stock Advisor analyst team just identified what they believe are the 10 best stocks for investors to buy now… and International Business Machines wasn’t one of them. The 10 stocks that made the cut could produce monster returns in the coming years.

Consider when Nvidia made this list on April 15, 2005... if you invested $1,000 at the time of our recommendation, you’d have $814,364!*

Stock Advisor provides investors with an easy-to-follow blueprint for success, including guidance on building a portfolio, regular updates from analysts, and two new stock picks each month. The Stock Advisor service has more than quadrupled the return of S&P 500 since 2002*.

See the 10 stocks »

*Stock Advisor returns as of October 7, 2024

John Mackey, former CEO of Whole Foods Market, an Amazon subsidiary, is a member of The Motley Fool’s board of directors. Suzanne Frey, an executive at Alphabet, is a member of The Motley Fool’s board of directors. Will Healy has no position in any of the stocks mentioned. The Motley Fool has positions in and recommends Alphabet, Amazon, Microsoft, Oracle, Salesforce, and Tencent. The Motley Fool recommends International Business Machines and Kyndryl and recommends the following options: long January 2026 $395 calls on Microsoft and short January 2026 $405 calls on Microsoft. The Motley Fool has a disclosure policy.

Disclaimer: For information purposes only. Past performance is not indicative of future results.
placeholder
Ethereum Price Slips Lower — $3,000 Looms as the Key BattlegroundEthereum is attempting to recover from a $3,026 low but remains below $3,200 and the 100-hour SMA, with a bearish trend line near $3,175 capping rebounds as bulls need a clean break above $3,200 to target $3,250–$3,400, while a drop below $3,050 risks a retest of $3,000 and $2,940.
Author  Mitrade
Dec 15, Mon
Ethereum is attempting to recover from a $3,026 low but remains below $3,200 and the 100-hour SMA, with a bearish trend line near $3,175 capping rebounds as bulls need a clean break above $3,200 to target $3,250–$3,400, while a drop below $3,050 risks a retest of $3,000 and $2,940.
placeholder
Bitcoin Slides 5% as Sellers Lean In — Can BTC Reclaim $88,000?Bitcoin has dropped back below $88,000 after rolling over from $90,500, with price still trading under the 100-hour Simple Moving Average. The sell-off found a floor at $85,151, and BTC is now consolidating near that base, but rebounds are facing pressure from a bearish trend line around $89,000. Bulls need to retake $88,000–$89,000 to ease downside risk; failure to do so keeps $85,500–$85,000 and then $83,500 in play, with $80,000 as the deeper “line in the sand.” Bitcoin (BTC) is back in damage-control mode after a sharp pullback wiped out recent gains. The price failed to reclaim the $90,000–$90,500 band, rolled over, and slid through $88,500 before briefly dipping under $87,000. Buyers did show up around $85,000, but the rebound so far looks more like stabilization than a clear trend reversal. Bitcoin dips hard, finds a bid near $85,000(h3) BTC’s latest move lower began when it couldn’t build follow-through above $90,000 and $90,500. Once that upside stalled, sellers took control and pushed price down through $88,500. The slide accelerated enough to spike below $87,000, but the market didn’t free-fall. Bulls defended the $85,000 zone, printing a low at $85,151. Since then, Bitcoin has been consolidating below the 23.6% Fibonacci retracement of the drop from the $93,560 swing high to the $85,151 low — a clue that the bounce is still shallow and that sellers haven’t fully backed off yet. Structurally, BTC is still on the back foot: It’s trading below $88,000, and It remains below the 100-hour Simple Moving Average, keeping short-term trend pressure pointed downward. Resistance is layered, and $89,000 is the problem area(h3) If bulls try to turn this into a recovery, they’ll have to climb through multiple ceilings in quick succession. First, BTC faces resistance around $87,150, followed by a more meaningful barrier near $87,500. From there, the market’s attention snaps back to $88,000 — the level BTC just lost and now needs to reclaim. A close back above $88,000 would improve the tone, but it doesn’t solve the bigger issue: there’s a bearish trend line on the hourly BTC/USD chart (Kraken feed) with resistance near $89,000, which also lines up with the next technical hurdle. If BTC can push through $89,000 and hold, the rebound could extend toward $90,000, with follow-through targets at $91,000 and $91,500. But until price clears that $88,000–$89,000 zone, rallies are at risk of being sold rather than chased. If BTC fails to reclaim resistance, the downside path is clear(h3) The near-term bear case is simple: if Bitcoin can’t climb back above the $87,000 area and keep traction, sellers may attempt another leg lower. Support levels line up like this: Immediate support: $85,500 First major support: $85,000 Next support: $83,500 Then $82,500 in the near term Below that, the major “don’t break this” level is still $80,000. If BTC slips under $80,000, the risk of acceleration to the downside increases significantly — not because it’s magic, but because it’s the kind of psychological and structural level that tends to trigger forced de-risking. Indicators: momentum still leans bearish(h3) The intraday indicators aren’t offering much comfort yet: Hourly MACD is losing pace in the bearish zone. Hourly RSI remains below 50, suggesting sellers still have the upper hand on short timeframes. So while the $85,000 defense held for now, the market hasn’t flipped bullish — it’s just stopped bleeding.
Author  Mitrade
Dec 16, Tue
Bitcoin has dropped back below $88,000 after rolling over from $90,500, with price still trading under the 100-hour Simple Moving Average. The sell-off found a floor at $85,151, and BTC is now consolidating near that base, but rebounds are facing pressure from a bearish trend line around $89,000. Bulls need to retake $88,000–$89,000 to ease downside risk; failure to do so keeps $85,500–$85,000 and then $83,500 in play, with $80,000 as the deeper “line in the sand.” Bitcoin (BTC) is back in damage-control mode after a sharp pullback wiped out recent gains. The price failed to reclaim the $90,000–$90,500 band, rolled over, and slid through $88,500 before briefly dipping under $87,000. Buyers did show up around $85,000, but the rebound so far looks more like stabilization than a clear trend reversal. Bitcoin dips hard, finds a bid near $85,000(h3) BTC’s latest move lower began when it couldn’t build follow-through above $90,000 and $90,500. Once that upside stalled, sellers took control and pushed price down through $88,500. The slide accelerated enough to spike below $87,000, but the market didn’t free-fall. Bulls defended the $85,000 zone, printing a low at $85,151. Since then, Bitcoin has been consolidating below the 23.6% Fibonacci retracement of the drop from the $93,560 swing high to the $85,151 low — a clue that the bounce is still shallow and that sellers haven’t fully backed off yet. Structurally, BTC is still on the back foot: It’s trading below $88,000, and It remains below the 100-hour Simple Moving Average, keeping short-term trend pressure pointed downward. Resistance is layered, and $89,000 is the problem area(h3) If bulls try to turn this into a recovery, they’ll have to climb through multiple ceilings in quick succession. First, BTC faces resistance around $87,150, followed by a more meaningful barrier near $87,500. From there, the market’s attention snaps back to $88,000 — the level BTC just lost and now needs to reclaim. A close back above $88,000 would improve the tone, but it doesn’t solve the bigger issue: there’s a bearish trend line on the hourly BTC/USD chart (Kraken feed) with resistance near $89,000, which also lines up with the next technical hurdle. If BTC can push through $89,000 and hold, the rebound could extend toward $90,000, with follow-through targets at $91,000 and $91,500. But until price clears that $88,000–$89,000 zone, rallies are at risk of being sold rather than chased. If BTC fails to reclaim resistance, the downside path is clear(h3) The near-term bear case is simple: if Bitcoin can’t climb back above the $87,000 area and keep traction, sellers may attempt another leg lower. Support levels line up like this: Immediate support: $85,500 First major support: $85,000 Next support: $83,500 Then $82,500 in the near term Below that, the major “don’t break this” level is still $80,000. If BTC slips under $80,000, the risk of acceleration to the downside increases significantly — not because it’s magic, but because it’s the kind of psychological and structural level that tends to trigger forced de-risking. Indicators: momentum still leans bearish(h3) The intraday indicators aren’t offering much comfort yet: Hourly MACD is losing pace in the bearish zone. Hourly RSI remains below 50, suggesting sellers still have the upper hand on short timeframes. So while the $85,000 defense held for now, the market hasn’t flipped bullish — it’s just stopped bleeding.
placeholder
December Santa Claus Rally: New highs in sight for US and European stocks?Historical data show a rising trend of US and European stocks in December. If the momentum is strong, fund managers may rush in with a buying frenzy.
Author  Mitrade
Yesterday 02: 50
Historical data show a rising trend of US and European stocks in December. If the momentum is strong, fund managers may rush in with a buying frenzy.
placeholder
XRP’s Price Action Flashes a Warning Even as ETF Flows Stay PositiveXRP’s structure remains weak despite 18 straight positive closes in spot XRP ETFs, with analysts warning that $1.98 and other nearby resistance zones could cap rebounds unless the YO region is reclaimed, while deeper downside scenarios keep $1.53 on watch as a potential (not guaranteed) accumulation area.
Author  Mitrade
Yesterday 06: 37
XRP’s structure remains weak despite 18 straight positive closes in spot XRP ETFs, with analysts warning that $1.98 and other nearby resistance zones could cap rebounds unless the YO region is reclaimed, while deeper downside scenarios keep $1.53 on watch as a potential (not guaranteed) accumulation area.
placeholder
Gold declines on profit-taking, USD strength ahead of US CPI releaseGold price (XAU/USD) edges lower below $4,350 during the Asian trading hours on Thursday. The precious metal retreats from seven-week highs amid some profit-taking and a rebound in the US Dollar (USD).
Author  FXStreet
7 hours ago
Gold price (XAU/USD) edges lower below $4,350 during the Asian trading hours on Thursday. The precious metal retreats from seven-week highs amid some profit-taking and a rebound in the US Dollar (USD).
goTop
quote