


Target Reports Today With Options Pricing a 9% Swing, and TGT Needs to Clear $161.11
TradingKey - Target (NYSE: TGT) reports fiscal third-quarter results before the US market opens on Wednesday, November 18. The stock was trading at $159.53 late Tuesday, November 17, and premarket quotes are higher at $160.50 ahead of the release.
Options traders expect a big reaction. They are pricing a move of about 9.1% in either direction, according to TipRanks, while Target's last four post-earnings moves averaged just 1.75%. On a $160 stock, that implies a swing of roughly $14.50.
What Analysts Expect From the Quarter
Expectations are clustered tightly. Zacks consensus calls for EPS of $2.05, up about 15% from $1.78 a year earlier, while TipRanks puts it at $2.07. Revenue is expected at about $26.4 billion to $26.5 billion, up 4.4% to 4.7%. Comparable sales, which compare sales from stores open at least a year plus digital orders, are expected to rise about 3% to 3.8%.
Target has a strong record against forecasts. It has beaten EPS estimates by an average of about 10.5% over the past four quarters, according to Zacks, which rates the stock a Buy and expects another beat. The bar is higher this time, though, because the second quarter set a strong benchmark, with comparable sales up 3.8% and traffic up 3.6%, as more shoppers came back under CEO Michael Fiddelke.
The First Quarter Without the Tariff Refund
The headline EPS figure will look very different from the second quarter, and that is expected. Second-quarter EPS of $4.11 included a one-time $994 million tariff refund worth about $1.65 a share. Target's full-year EPS guidance of $9.90 to $10.90 includes that refund. By my calculation, it implies $8.25 to $9.25 without it, and the full-year analyst estimate of about $8.89 sits inside that range.
That makes the underlying margins the first real test. Investors will want to see whether gross and operating margins held up without one-time help, and whether the price cuts on nearly 2,000 home, apparel and accessories items in late September lifted sales in those weaker categories without eroding profit. Home furnishings and decor sales fell 6.5% last fiscal year, so any sign of a turn there would matter.
Guidance Will Likely Matter More Than the Beat
The holiday outlook is the bigger swing factor. For the fourth quarter, analysts expect EPS of about $2.68 on revenue of about $31.8 billion. Telsey Advisory's Joseph Feldman, who rates the stock a Buy with a $182 target, expects third-quarter results roughly in line, with EPS of $2.07 and comparable sales up 3%, and a fourth-quarter EPS of $2.66, slightly below consensus. Jefferies' Corey Tarlowe is more upbeat, raising his target to $190 from $185 and calling Target a top pick, with expected comparable sales growth of 3.8% and EPS of $2.10.
Whether Target keeps, narrows or raises its $9.90 to $10.90 full-year range will likely decide the direction of the move. A raise would suggest the turnaround is holding into the holidays. A cut, or a cautious holiday comment, could hit a stock that has already priced in a lot of good news.
A Rally That Leaves Little Room for Error
The stock is up about 65% this year, according to TipRanks, and trades at about 16.5 times forward earnings, above its 12-month median of about 15.2 times, according to Zacks. That is still far below Costco at about 48 times and in line with Dollar General at about 16.4 times. Analysts are split, with 12 Buys, 15 Holds and 2 Sells, and the average target of $169.54 sits only about 6% above the current price.
So the setup cuts both ways. A beat on comparable sales with steady guidance could push the stock through resistance, while any miss on margins could trigger a sharp drop, given how much is priced in. Walmart reports on Thursday, November 19, so investors will compare the two holiday outlooks within a day.
Target Technical Analysis: 4-Hour Close Above $161.11 Could Open $166.31
That tension shows clearly on the 4-hour chart. Buyers stepped in right at the red moving average near $157.10, a line that tracks the average price over recent sessions, close to the 38.2% Fibonacci retracement at $157.97, a common pullback level. That bounce keeps the November uptrend intact. Even so, the stock has struggled to clear $161.11, which has capped rallies for the past week. An earnings marker on the chart points to a sharp move soon, once the results are out.
RSI, a momentum gauge that runs from 0 to 100, sits near 52, a neutral reading. The MACD, another momentum indicator, is slightly negative, so momentum has cooled but has not turned bearish.
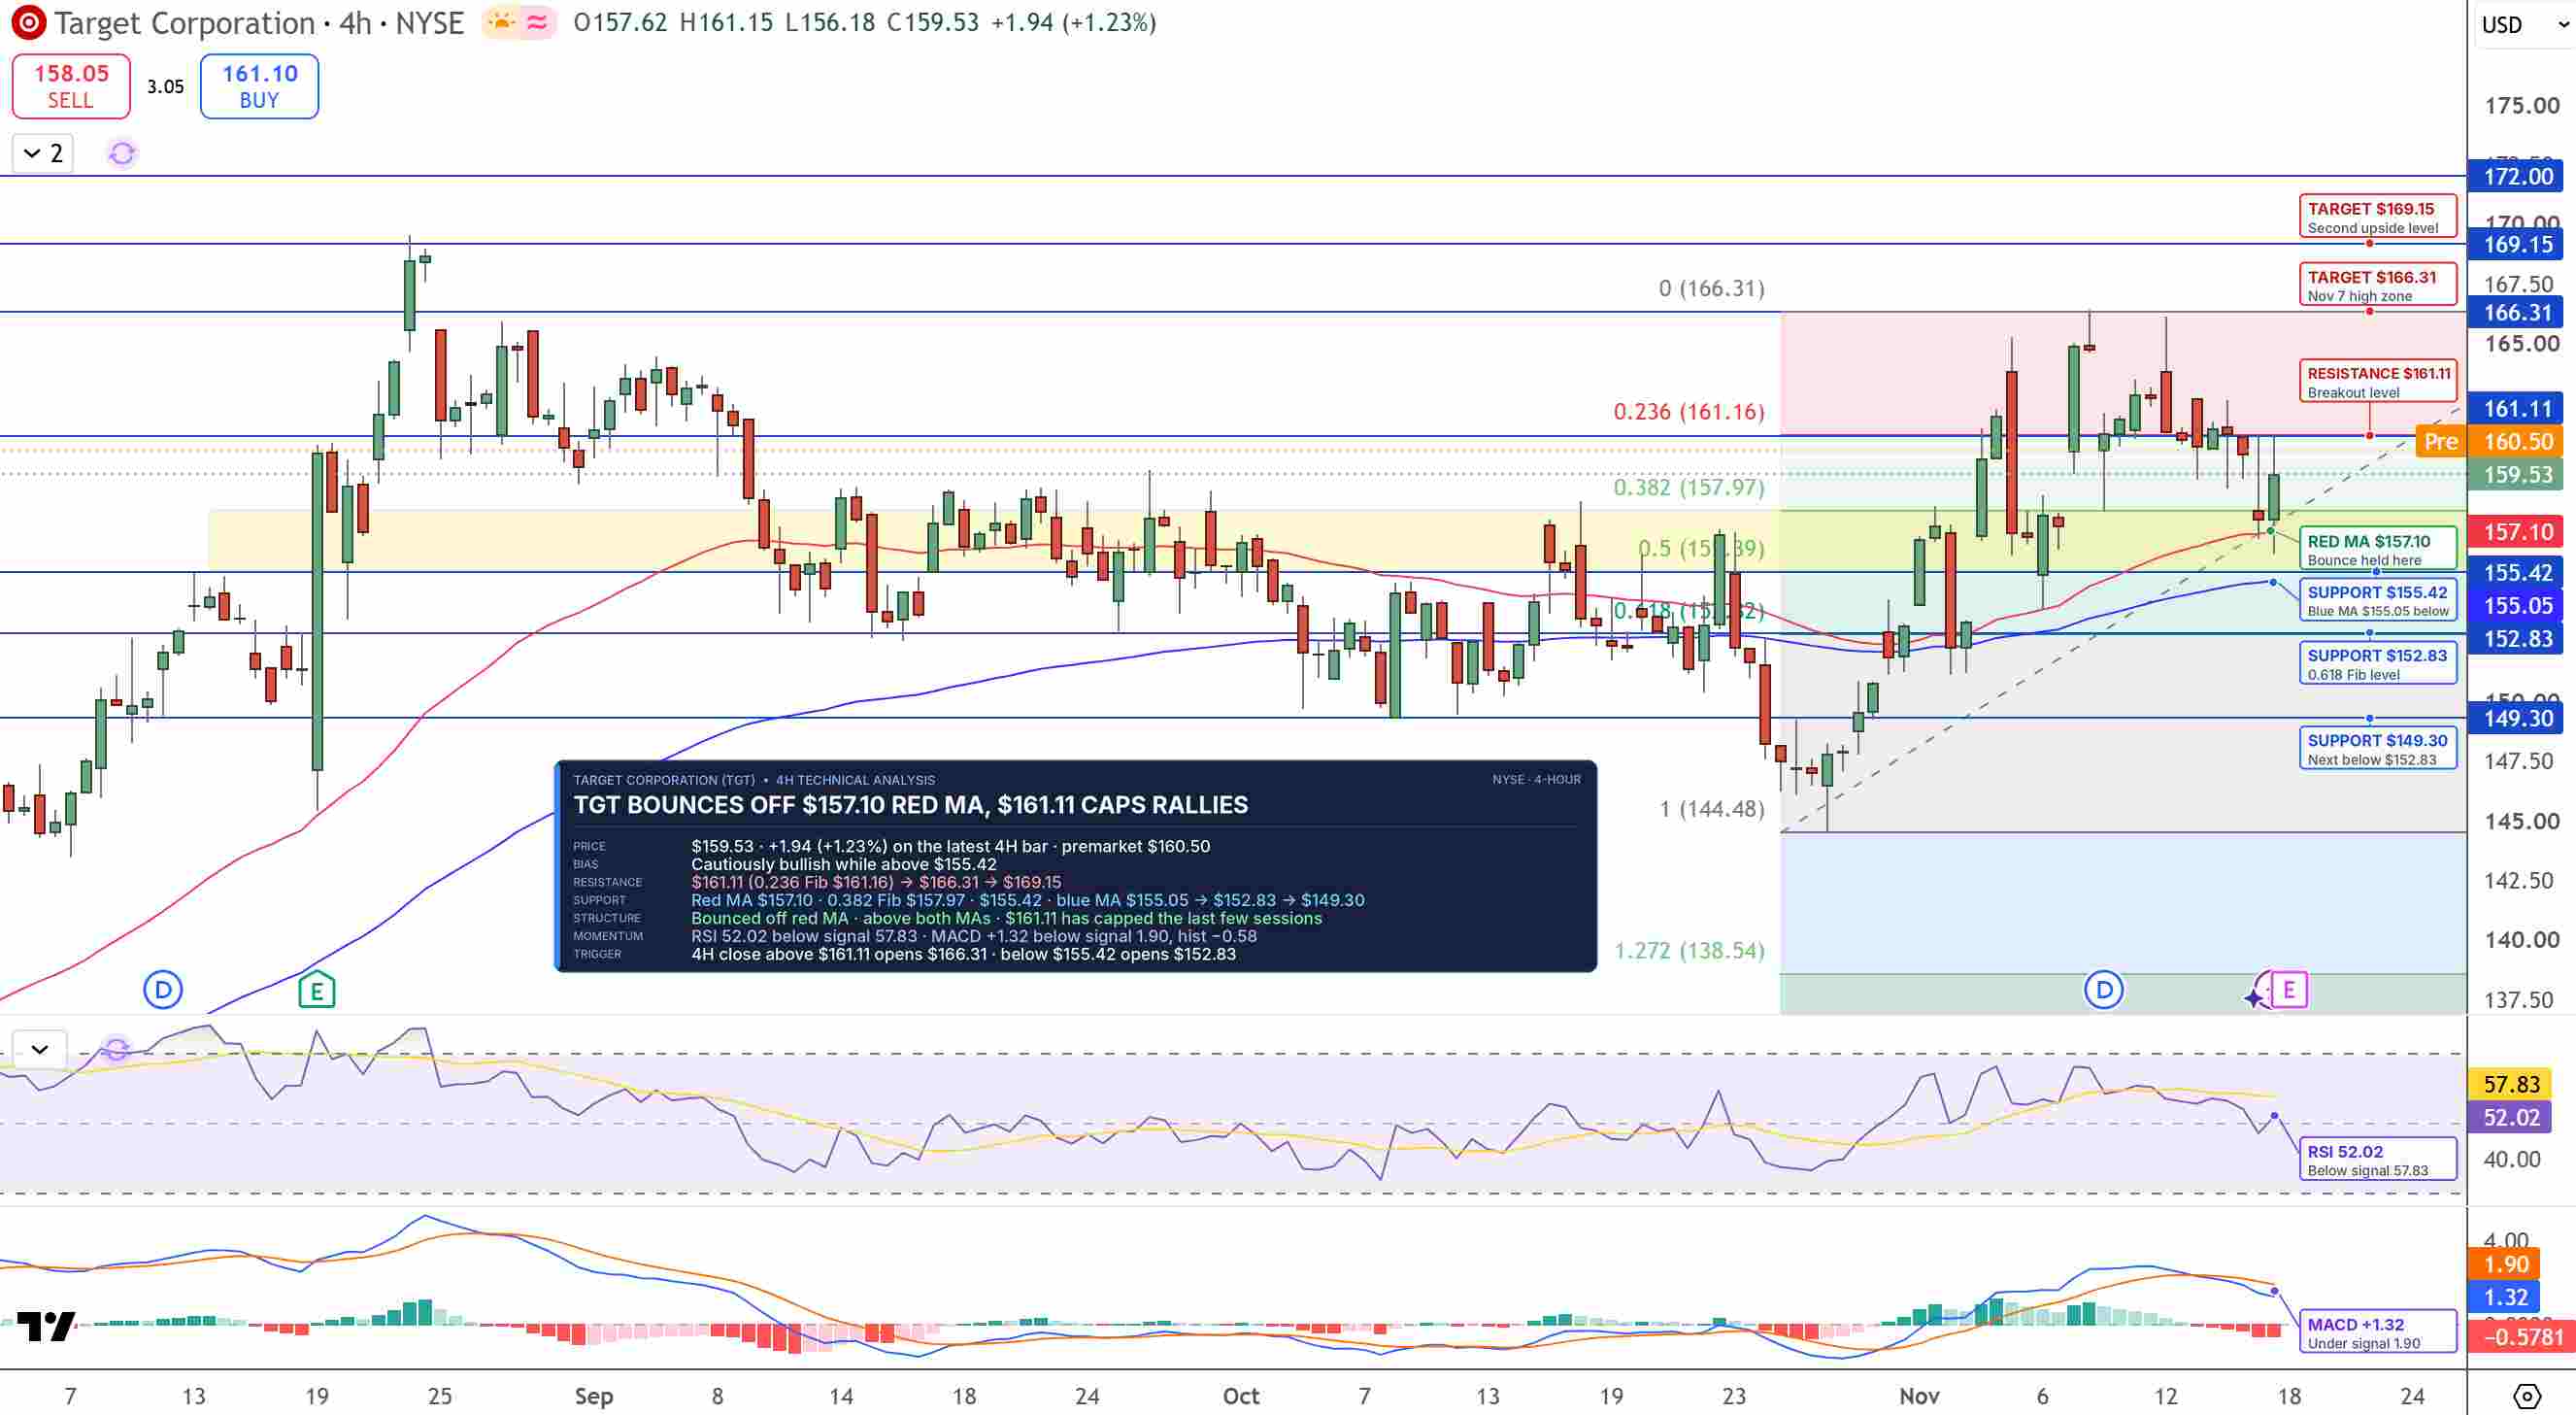
TGT Price Chart - Source: Tradingview
A 4-hour close above $161.11 could open $166.31, followed by $169.15. On the downside, a drop below $155.42 could send TGT toward $152.83, followed by $149.30.
I'm cautiously bullish while TGT holds above $155.42, with $161.11 as the breakout level to watch.
Key Levels
- Last price: $159.53 on Tuesday, November 17 (premarket: $160.50)
- Support: $157.10, $155.42, $152.83, $149.30
- Resistance: $161.11, $166.31, $169.15
- RSI: 52.02
- Bullish trigger: 4-hour close above $161.11
- Bearish trigger: 4-hour close below $155.42
FAQs
What do analysts expect from Target's Q3 earnings?
Analysts expect EPS of about $2.05 to $2.07 on revenue of about $26.4 billion to $26.5 billion, with comparable sales up about 3% to 3.8%. Options are pricing a move of about 9.1% in either direction.
What is the Target stock forecast before earnings?
The bias is cautiously bullish while TGT holds above $155.42. A 4-hour close above $161.11 could open $166.31 and $169.15, while a drop below $155.42 could send the stock toward $152.83 and $149.30.
Bottom Line
Target goes into its first quarter without the tariff refund after a strong rally, with options pricing a far bigger move than usual. The level that matters is $161.11. In my view, a 4-hour close above it after the report would confirm the uptrend, while a drop below $155.42 would suggest the market was disappointed by the margins or the holiday outlook.
Recommended Articles


