


Nvidia Beats by $7 Billion in Its First Quarter Without Huang, but NVDA Must Hold $149.13
TradingKey - Nvidia (NASDAQ: NVDA) closed at $155.46 on Tuesday, November 17, down 0.44%, before reporting fiscal third-quarter results that beat estimates by a wide margin. The stock jumped as much as 4.81% to $162.94 after hours, but overnight trading has eased to $157.29, only about 1.2% above the close.
The stock is down 4.54% so far this week and about 35% below its October 6 record close of $239.24. The report was Nvidia's first since Jensen Huang resigned as CEO on November 12, and interim CEO Colette Kress, who remains CFO, led the call.
A Strong Beat on Every Headline Number
Revenue rose 103% from a year earlier and 20% from the second quarter to $115.8 billion, about $7 billion above the $108.8 billion consensus and well above Nvidia's own guide of $108.0 billion. Data center revenue rose 110% to $107.6 billion, against about $101.9 billion expected, and Edge Computing revenue, which includes gaming, rose 42% to $8.2 billion.
Non-GAAP EPS, which excludes items such as stock-based pay, came in at $2.68, against a $2.47 estimate, and GAAP net income rose 105% to $65.3 billion. Gross margin, the share of revenue left after production costs, was 74.8% on a GAAP basis, down 0.2 percentage point from the second quarter but up 1.4 points from a year earlier.
Vera Rubin, Nvidia's new chip platform, began shipping during the quarter in what the company called the fastest product ramp in its history, with racks running at CoreWeave, Google Cloud, Microsoft Azure, Oracle Cloud Infrastructure and Nebius. Kress said, "Vera Rubin is off to an explosive start, our roadmap is on track and our ambition has never been greater." She added, "Our momentum is real."
Guidance Points Higher, but Margins Dip
For the fourth quarter, Nvidia guided revenue to $130.0 billion, plus or minus 3%, or $126.1 billion to $133.9 billion, against a $125.3 billion consensus. The quarter includes an extra week, and the outlook still assumes no data center compute revenue from China. According to CoinDesk, Nvidia also raised its fiscal 2028 revenue growth outlook to about 75%, from about 70%.
The weak spot is margin. Nvidia expects fourth-quarter gross margin of 71% to 72%, about 3.4 points below the third quarter's 74.9% non-GAAP margin at the midpoint. The release did not explain the drop. Nvidia also reported $390 billion of purchase commitments and $118 billion of guarantees, about $508 billion combined, and Kress said some guarantees depend on customers securing funding and preparing their data centers.
Nvidia returned $28.1 billion to shareholders in the third quarter, and about $227 billion remains under its share buyback authorization after a $150 billion increase approved in September.
Why the Rally Faded Overnight
A revenue beat of about $7 billion and a fourth-quarter guide about $4.7 billion above consensus would usually lift the stock sharply, yet most of the after-hours gain has already faded. The business is not the problem. Investors are still pricing leadership and policy risk.
The board said on Tuesday it had formed a national security and export control oversight committee, a day after the Commerce Department announced license requirements for advanced chip shipments to Brazil, Indonesia, Malaysia, Singapore and Thailand. The board does not plan to reinstate Huang, according to CNBC and The Wall Street Journal, and the search for a permanent CEO continues. Those questions, plus the lower margin guide, are weighing on a stock that, by my calculation, trades at about 14.5 times annualized third-quarter non-GAAP EPS.
Nvidia Technical Analysis: Weekly Close Below $149.13 Could Open $129.15
That caution shows clearly on the weekly chart. The selloff has pushed the stock into the $149.13 to $167.14 demand zone, a price area where buying has appeared before, which also lines up with the long-term rising trendline from 2024, a line drawn under its higher lows. Buyers defended this area at the $150.33 low, which makes it a key test. NVDA has slipped below the blue moving average at $175.35, though, a line that tracks the average price over recent weeks, so the near-term trend favors sellers.
RSI, a momentum gauge that runs from 0 to 100, has dropped to about 31, close to the oversold level of 30, where selling is often seen as stretched. The MACD, another momentum indicator, is falling sharply, which confirms strong bearish momentum.
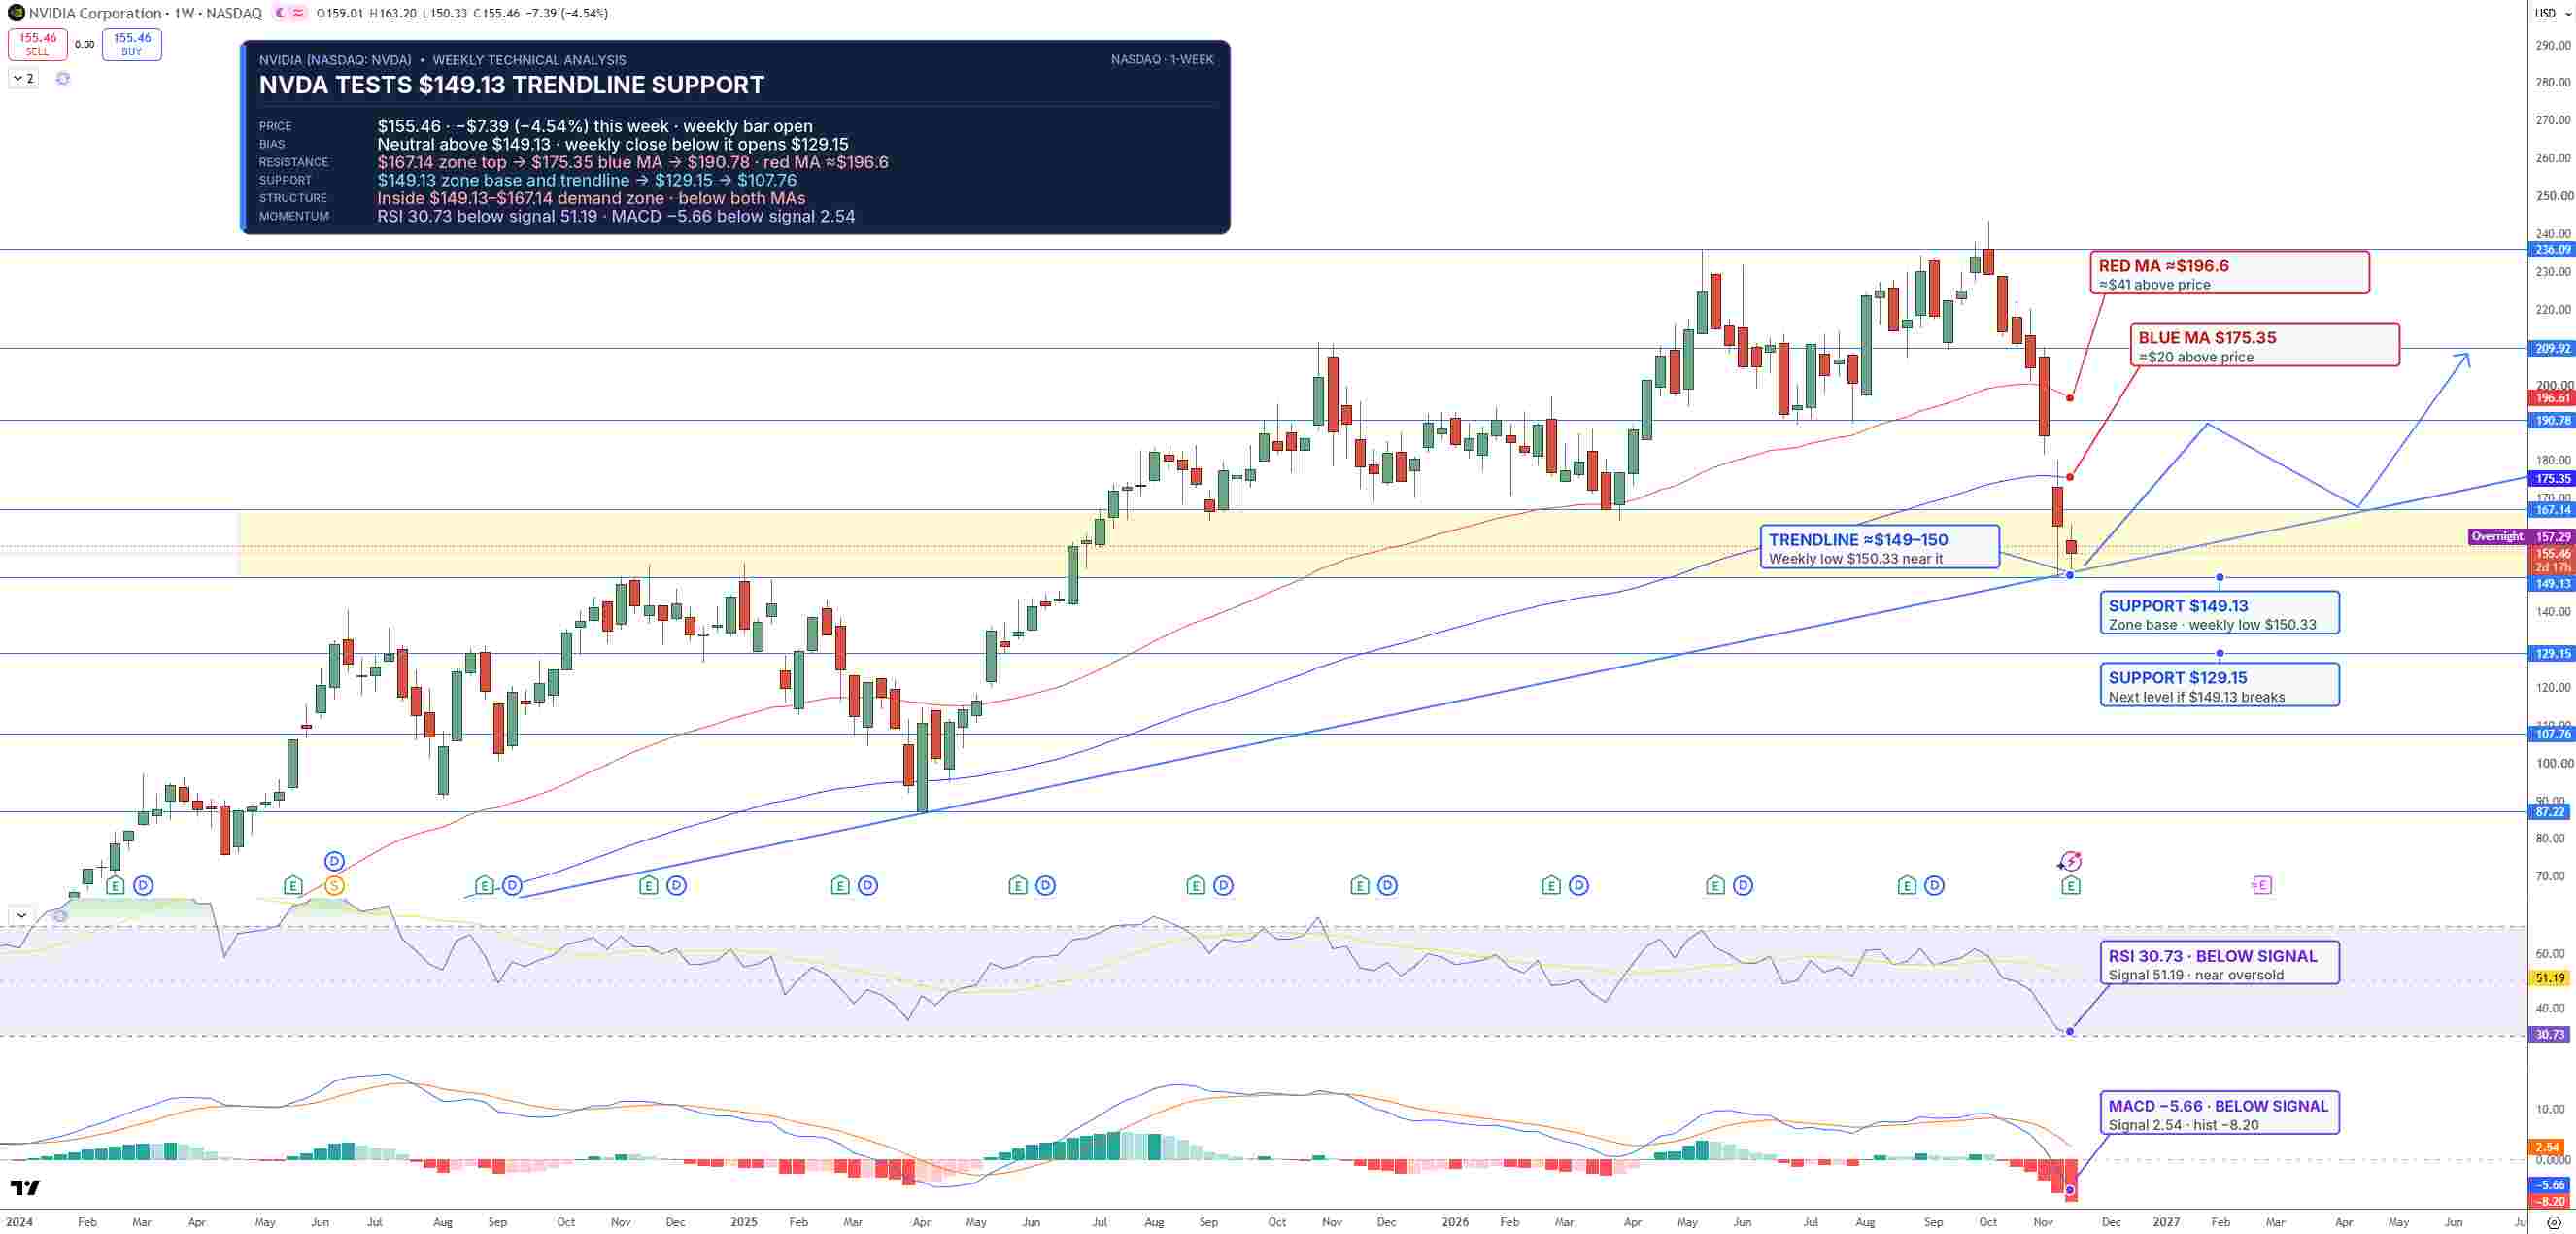
NVDA Price Chart - Source: Tradingview
If $149.13 holds, a bounce toward $175.35 and $190.78 is possible. A weekly close below $149.13, however, would break the trendline and could send NVDA toward $129.15.
I'm cautiously neutral while NVDA holds $149.13, and a weekly close above $167.14 would favor a rebound.
Key Levels
- Last close: $155.46, down 0.44% on Tuesday, November 17 (overnight: $157.29)
- Support: $149.13, $129.15
- Resistance: $167.14, $175.35, $190.78
- RSI: 30.73 (weekly)
- Bullish trigger: Weekly close above $167.14
- Bearish trigger: Weekly close below $149.13
FAQs
How did Nvidia do in Q3 fiscal 2027?
Nvidia reported revenue of $115.8 billion, up 103%, and non-GAAP EPS of $2.68, both well above estimates. It guided fourth-quarter revenue to $130.0 billion, plus or minus 3%, but expects gross margin to fall to 71% to 72%.
What is the Nvidia stock forecast now?
The bias is cautiously neutral while NVDA holds $149.13 on the weekly chart. A weekly close above $167.14 would favor a rebound toward $175.35 and $190.78, while a weekly close below $149.13 could open $129.15.
Bottom Line
Nvidia's first report without Huang showed the business is still growing fast, but the stock remains tied to leadership, export rules and a lower margin guide. The level that matters is $149.13. In my view, holding it keeps a rebound toward $167.14 and $175.35 possible, while a weekly close below it would open the way toward $129.15.
Recommended Articles


