


Micron Plunges 8% in a Day Near Six-Month Low: Can $700 Support Hold?
TradingKey - Micron Technology (MU) closed down 7.6% on Monday at $719.02, hitting an intraday low of $706.83, as shares weakened for a third consecutive trading day and neared a nearly six-month low. Further U.S. tightening of artificial intelligence chip export rules, coupled with Nvidia's (NVDA) management turmoil and market doubts over AI investment returns, prompted a concentrated capital outflow from the semiconductor sector.
The U.S. Commerce Department's Bureau of Industry and Security issued an interim final rule, extending regulatory oversight from physical shipments of advanced chips to remote computing power provided by overseas data centers. The new rule aims to close channels through which restricted countries lease high-end U.S. processors via third-party data centers, preventing relevant entities from remotely accessing advanced artificial intelligence computing resources without directly importing chips.
Under the regulations, overseas data centers providing substantial remote computing power to enterprises in regions of concern, such as China, Russia, and Iran, must identify end-users and conduct stricter due diligence on customer ownership and control relationships. Meanwhile, new licensing requirements will also apply to the export, re-export, or in-country transfer of advanced semiconductors to Singapore, Malaysia, Thailand, Indonesia, and Brazil. The U.S. government believes these markets present higher-than-average chip transshipment risks.
Markets are concerned that license reviews and customer vetting will lengthen server delivery cycles and increase uncertainty for overseas data center construction. Although Micron does not manufacture Nvidia-style artificial intelligence accelerators, its high-bandwidth memory, server DRAM, and data center storage products are closely tied to AI chip shipments. If cloud service providers delay procurement or scale back overseas projects, memory demand and pricing expectations could also be impacted.
Source: TradingView
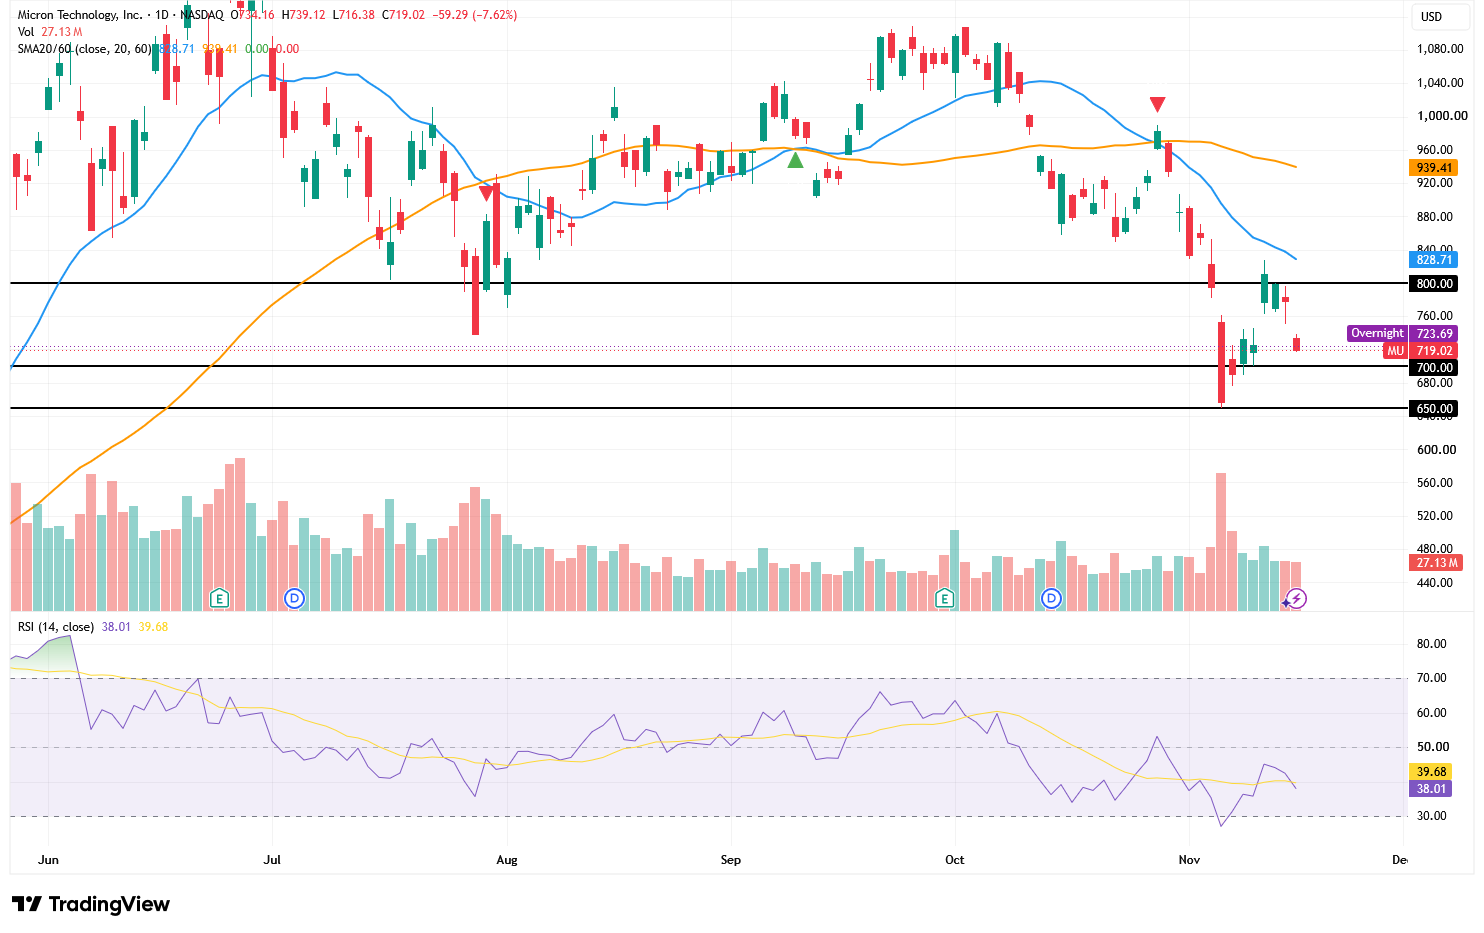
From the daily chart, Micron's stock price is once again approaching key support at $700. Since retreating from its October high of around $1,100, the stock has accumulated a decline of nearly 35%, forming a downward structure of lower highs and lower lows, with short-term bears continuing to dominate.
In terms of moving averages, Micron's stock price has clearly fallen below its 20-day moving average of $828.71 and 60-day moving average of $939.41, with the 20-day moving average trending below the 60-day moving average to form a bearish alignment. Even if the stock rebounds, the $800 psychological mark and the vicinity of the 20-day moving average are expected to exert significant resistance. Only by regaining firm footing above $800 and further reclaiming $829 could the current downtrend be initially mitigated; confirming a medium-term trend reversal would still require breaking above the 60-day moving average near $939.
Momentum indicators are likewise weak, with the 14-day RSI currently at around 38.01, below its signal line of 39.68, suggesting that buying momentum has yet to see a notable recovery. At the same time, the RSI has not yet dropped into oversold territory below 30, indicating that while the stock has retreated substantially, technicals have yet to offer a clear bottoming signal, leaving room for further downside testing.
In the short term, $700 is the critical level determining the trend. If the stock can halt its decline near $700 and stage a rebound supported by volume, it could initially recover toward the $760 to $800 range. However, if the daily close convincingly breaks below $700, the next support will shift down to around $650. A decline from $700 to $650 represents roughly 7% downside potential. The $650 level also marks a recent low and an important defensive zone over the past nearly six months; should it give way further, the stock could open up room for a retreat toward $600.
Recommended Articles


