


Dell Stock Forecast: Enterprise AI Push Meets $423.36 Resistance
TradingKey - Dell Technologies (NYSE: DELL) closed November 3 at $408.40, up 3.98%, according to Stock Analysis. Its latest enterprise AI push now includes a November 2 security announcement with CrowdStrike, building on October’s expanded Nvidia offering. The rebound still leaves the daily chart below broken trendline support and both moving averages.
The fundamental question is whether Dell can turn its $95 billion AI-server backlog into profitable deliveries and cash. November 24 earnings provide the next major test, with $423.36 the immediate chart barrier.
CrowdStrike Adds Security to Dell’s Enterprise AI Offering
The joint announcement allows customers to buy CrowdStrike security alongside Dell AI infrastructure and services within the Dell AI Factory with Nvidia. The offering covers AI applications and agents, the software that carries out tasks, as well as the infrastructure running them.
Security and operational support can help enterprises move beyond small trials. That gives Dell an opportunity to sell more complete deployments, but the announcement supplies no incremental revenue forecast. Its value will depend on customer adoption and the profitability of the services attached to hardware sales.
Nvidia Expansion Has Staggered Delivery Dates
Dell’s October announcement said more than 6,500 enterprises had adopted its AI Factory with Nvidia. The expansion includes a modular data-center design combining computing, storage, networking, power and cooling, scheduled for early 2027. Several new server platforms are also targeted for the first calendar quarter of 2027.
These are availability targets. Integrated systems still need customer power and suitable sites. Faster installation would help Dell convert demand into revenue; delays could leave equipment and funding tied up for longer.
Strong Earnings Establish a Higher Benchmark
The September 1 earnings release reported fiscal second-quarter revenue of $47 billion, up 58%, with GAAP diluted EPS of $6.34 and adjusted EPS of $7.04. Infrastructure Solutions Group revenue reached $31.8 billion, with operating income of $4.8 billion.
Growth extended beyond AI systems into traditional servers, networking and storage. I remain constructive on that broader operating momentum, although adjusted profit excludes costs that shareholders still need to consider. Profitability must hold as shipments increase.
The Backlog Must Become Revenue and Collections
Dell’s quarterly results recorded $60.9 billion in AI-server orders, $16.4 billion in AI-server revenue and a $95 billion closing backlog. These measure different stages: new commitments, recognized sales and business still awaiting delivery.
Another large order would support demand visibility, but delivery matters more now. Dell must secure components, assemble systems and collect payment on acceptable terms. Expensive processors can lift reported sales quickly; the earnings benefit depends on the margin retained after equipment and service costs.
Inventory and Receivables Put Cash Quality in Focus
The quarterly filing shows inventory of $21.3 billion at July 31, versus $10.4 billion at January 30. Accounts receivable, money customers owe, rose to $22.9 billion from $17.6 billion. Supplier payables also increased, partly funding the expansion.
I would want evidence that inventory becomes delivered systems and receivables become cash before treating rapid growth as fully self-funding. Rising balances can be normal during expansion, but slower collections or delayed acceptance would make the same growth more demanding to finance.
Dell’s debt disclosure lists $34.7 billion of total principal, including financing-related obligations, and approximately $14 billion of separately defined core debt. Cash and equivalents were $11.6 billion. Core debt excludes Dell Financial Services-related and other debt; it is not interchangeable with total borrowing.
November 24 Earnings Will Test the Guidance
Dell’s investor calendar schedules fiscal third-quarter results for November 24. The September guidance targets $49 billion in quarterly revenue and $6.50 in adjusted EPS. Full-year targets remain $192 billion in revenue, including $74 billion from AI-optimized servers, and adjusted EPS of $25.50.
Those figures are forecasts awaiting the next report. The strongest confirmation would be deliveries meeting expectations while margins and cash collections hold up. A larger backlog alongside weaker conversion would leave the central concern unresolved, even if headline demand remains strong.
Dell Technical Analysis: $423.36 Rejection Would Keep Sellers in Control
Dell’s latest completed close at $408.40 follows a sharp selloff, with the daily rebound still below the broken rising trendline and both moving averages. The former upward structure has weakened, so a single positive session does not establish a reversal.
I remain bearish while $423.36 holds as resistance, with rejection there needed to confirm renewed selling. Clearing it would bring the 100-day exponential moving average at $451.84 into focus. This average gives greater weight to recent prices. A daily close above $451.84 would invalidate the immediate bearish setup and favor recovery toward the 50-day EMA at $488.53.
RSI, a momentum gauge, stands at 35.59, showing weakness without reaching oversold territory below 30. MACD, another momentum indicator, remains negative and below its signal line. That leaves the rebound vulnerable unless buyers reclaim resistance. Support sits at $360.03; a daily close below it would open the way for $297.67. Until $423.36 breaks, the chart favors treating rallies cautiously rather than assuming the decline has ended.
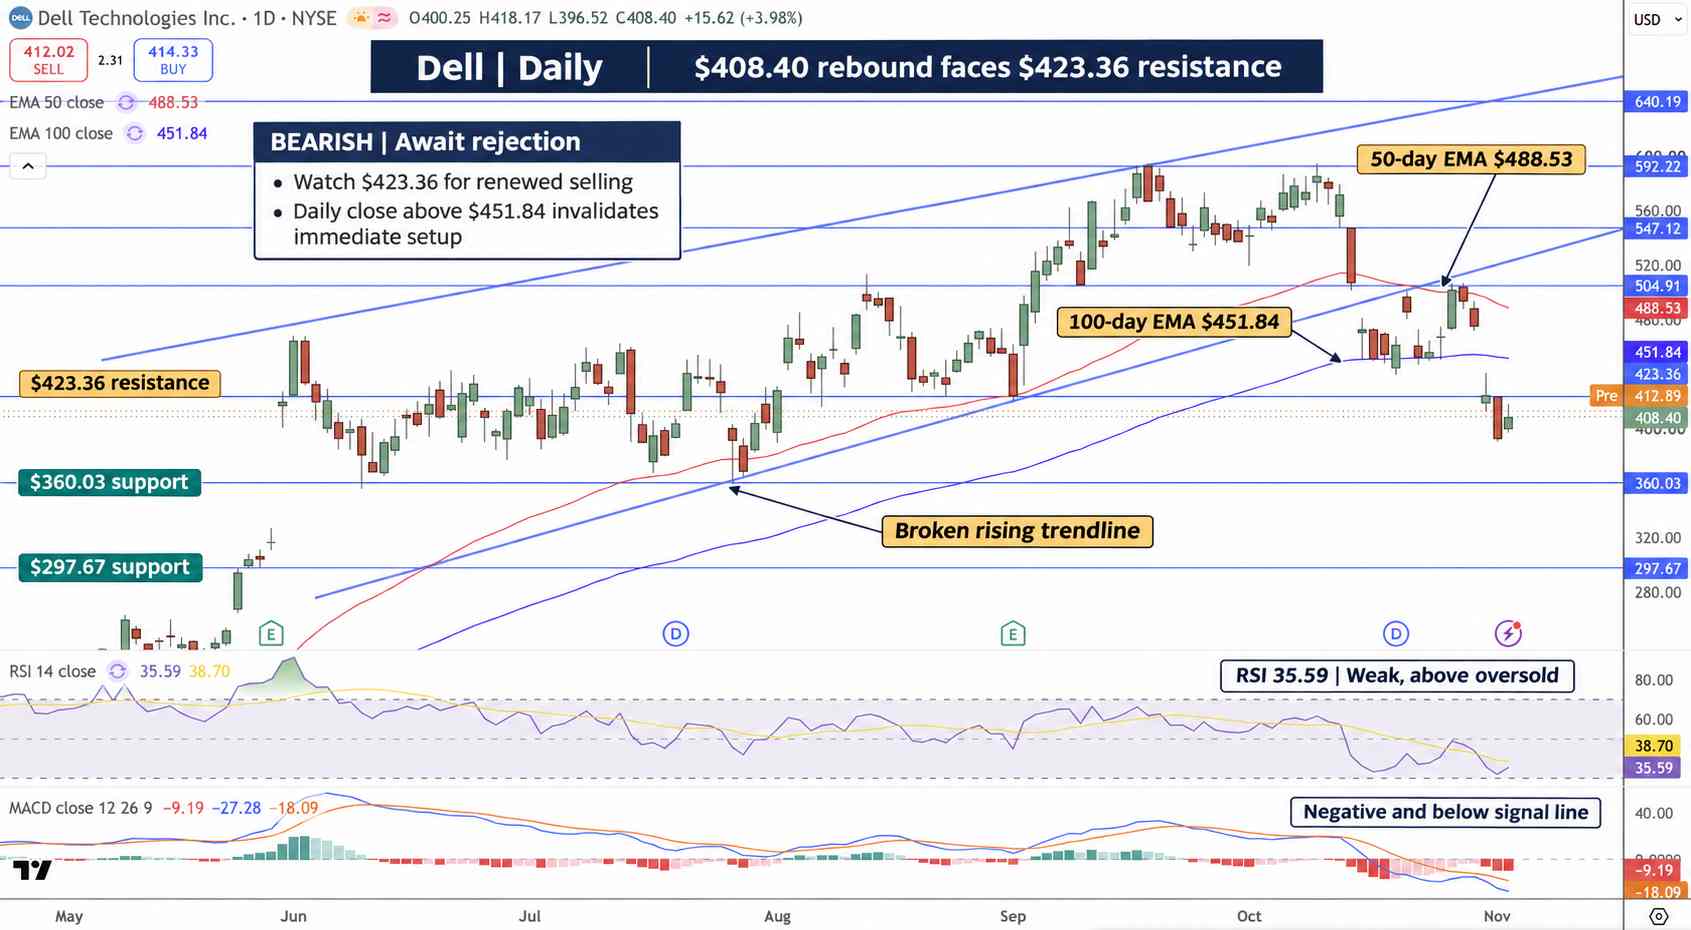
DELL Price Chart - Source: Tradingview
Key Levels
- Latest completed close: $408.40 on November 3, 2026
- Immediate resistance: $423.36
- Upside tests: $451.84, then $488.53
- Immediate support: $360.03
- Downside target: $297.67 after a daily close below $360.03
- RSI: 35.59, weak but not oversold
FAQ
Why is Dell’s AI backlog important?
The $95 billion backlog provides potential future sales visibility. Its value depends on delivery timing, margins and collections rather than its size alone.
What would improve Dell’s technical outlook?
Clearing $423.36 would strengthen the rebound. A daily close above $451.84 would invalidate the immediate bearish setup and put $488.53 in focus.
Bottom Line
Dell’s enterprise AI offering is expanding, but profitable backlog conversion remains the earnings test. The chart stays bearish while $423.36 limits recovery. A daily close above $451.84 would change that near-term view; below $360.03, the next downside level is $297.67.
Recommended Articles


