


1 of the Stock Market's Most Reliable Recession Warnings Just Disappeared. Here's What Usually Happens Next.
Key Points
Historically, a yield curve inversion has been a precursor to a recession.
But while the curve inverted in 2022, it hasn't led to a recession.
Even though interest rate hikes and inflation are risks, there's a path to higher stock prices today.
- 10 stocks we like better than S&P 500 Index ›
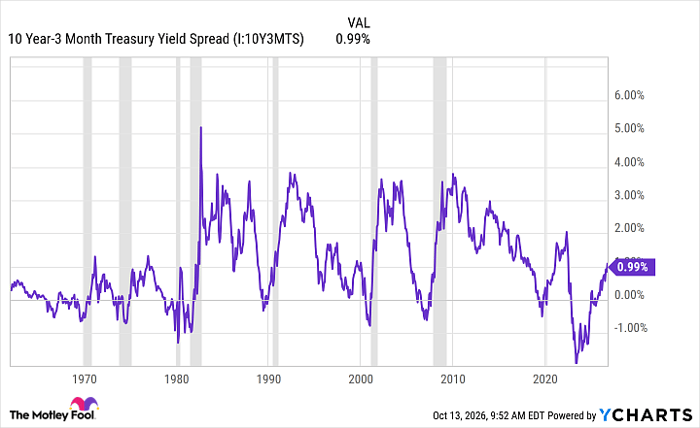
History shows that the 10-year/three-month Treasury yield spread has been one of the most reliable recession indicators.
The general premise is that once this spread turns negative, which is to say that the three-month Treasury yield becomes higher than the 10-year yield, a recession is likely to come sometime in the subsequent six to 18 months.
Missed AI’s "Act 1"? Act 2 Could Be 15x Bigger. Most investors think they missed the AI boat because they didn't buy Nvidia in 2005. But according to our analysts, we’re only at the end of "Act 1"—the R&D phase. "Act 2" is the global rollout. Continue »
Over the past 60-plus years, this inversion has occurred eight times. All eight times, a recession occurred shortly after this trigger fired.
The ninth time this happened was in late 2022. At its bottom, this spread went to nearly -200 basis points, the lowest reading it's ever had. But there was no recession. For the first time in well over half a century, this spread going negative did not precede a recession as it has historically.
10 Year-3 Month Treasury Yield Spread data by YCharts
While the recession usually arrives only after the curve has uninverted, this would be the longest lead time by far. In my opinion, the signal has disappeared.
But that doesn't mean recession risk is behind us. And it doesn't mean that the S&P 500 (SNPINDEX: ^GSPC) can't experience a correction here.
Image source: Getty Images.
Why the yield curve normalizing matters
The yield curve can steepen for a few reasons. The primary ones are rising inflation expectations, Treasury bond supply, and stronger economic growth.
The current environment features the first two with some of the third. The U.S. inflation rate has been in the 3% to 4% range for most of 2026. That's caused long-term yields to rise sharply while short-term yields, which are usually tied to what the Fed does, have moved comparatively little. This is what's called a "bear steepener" and is often a bad environment for rate-sensitive sectors.
But current U.S. economic growth is softening the blow. Corporate earnings growth has been strong, and GDP growth has, for now, remained well in positive territory. When these dynamics are in place, stock prices often have room to rise even as long-term interest rates rise.
Here's what I'd do with my portfolio
Outside of the obvious fact that it's impossible to predict the future, there's also no evidence that a recession or a market correction is imminent. I'd maintain long-term positions in the Vanguard S&P 500 ETF, the Vanguard Total Stock Market ETF, and similar funds.
Inflation and government debt are clearly risks. But oil prices seem to be peaking, and it's easy to see a scenario where inflation comes back down quickly with a resolution to the Iran war. If the markets can avoid a lengthy Fed hiking cycle, I think stocks will be just fine.
Should you buy stock in S&P 500 Index right now?
Before you buy stock in S&P 500 Index, consider this:
The Motley Fool Stock Advisor analyst team just identified what they believe are the 10 best stocks for investors to buy now… and S&P 500 Index wasn’t one of them. The 10 stocks that made the cut could produce monster returns in the coming years.
Consider when Netflix made this list on December 17, 2004... if you invested $1,000 at the time of our recommendation, you’d have $379,986!* Or when Nvidia made this list on April 15, 2005... if you invested $1,000 at the time of our recommendation, you’d have $1,404,152!*
Now, it’s worth noting Stock Advisor’s total average return is 948% — a market-crushing outperformance compared to 215% for the S&P 500. Don't miss the latest top 10 list, available with Stock Advisor, and join an investing community built by individual investors for individual investors.
See the 10 stocks »
*Stock Advisor returns as of October 15, 2026.
David Dierking has positions in Vanguard Morningstar Total Stock Market ETF. The Motley Fool has positions in and recommends Vanguard S&P 500 ETF. The Motley Fool has a disclosure policy.
Recommended Articles


