


Prediction: A Stock Market Crash Is Coming. Here’s the One Move You Should Make, According to History.
Key Points
The S&P 500 has climbed in recent years and is heading for a double-digit gain in 2026.
Stocks are looking expensive, though, and this could prompt investors to think twice before buying.
- 10 stocks we like better than S&P 500 Index ›
The S&P 500 has soared over the past few years amid excitement about artificial intelligence (AI) companies and a generally positive economic backdrop. Recent times have brought economic headwinds -- such as rising inflation -- and questions about whether the AI revenue opportunity would make today's infrastructure spending worthwhile. Still, the benchmark has continued to advance, reaching new record highs. It's now heading for a 12% annual gain.
My prediction, though, is that this momentum won't last forever and that a stock market crash may be on the way. Of course, this doesn't mean a crash will happen tomorrow. It might happen in a few months or in a year or so, but considering the points I'll make below, a crash will eventually take place.
Missed AI’s "Act 1"? Act 2 Could Be 15x Bigger. Most investors think they missed the AI boat because they didn't buy Nvidia in 2005. But according to our analysts, we’re only at the end of "Act 1"—the R&D phase. "Act 2" is the global rollout. Continue »
Here's the good news, though: A crash doesn't have to mean disaster for you as an investor. History shows us there's one particular move you should make -- and it's likely to result in a win. Let's check it out.

Image source: Getty Images.
Crashes are part of market cycles
So, first, how can I be so sure a market crash is ahead? Crashes are a normal part of market cycles, occurring from time to time throughout history. So it's very likely that these market events will take place again in the future.
I predict that one may be on the way, given a particular point that has worried investors in recent times: the valuation of stocks. A look at the S&P 500 Shiller CAPE ratio shows us that stocks are trading at a level they've only reached once before throughout history -- during the dot-com bubble, which led to a crash. This metric is a valuable one as it considers stock prices in relation to earnings per share over 10 years, accounting for fluctuations in the economy.
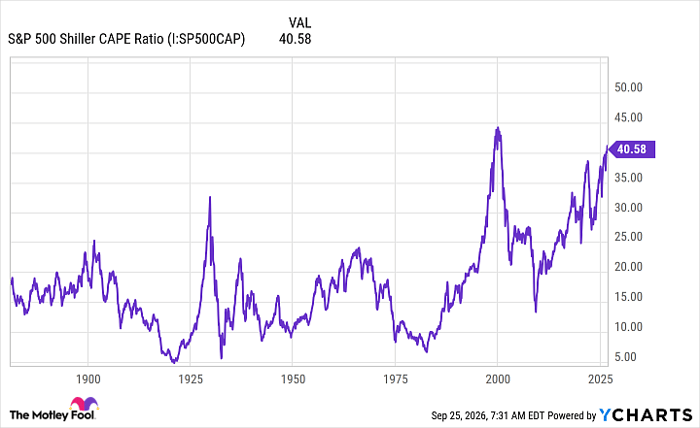
S&P 500 Shiller CAPE Ratio data by YCharts
This doesn't mean we're about to immediately see another dot-com-sized crash. Stocks may simply dip somewhat, leading valuations a bit lower, and a crash might happen much farther down the road. But the valuation levels we're seeing today could justify a decline -- even if it's not a major one.
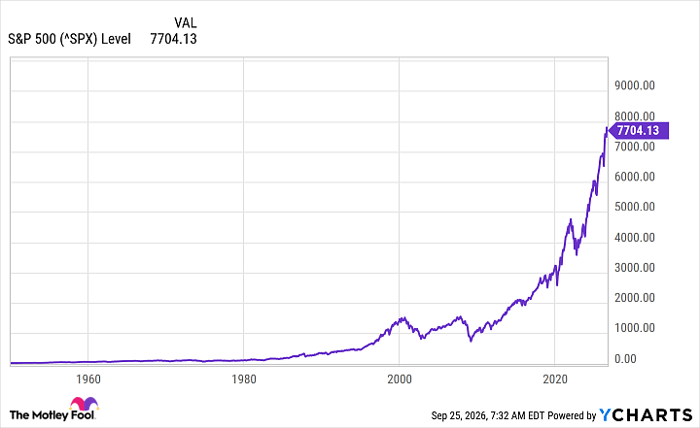
Now, let's consider the one move you should make to protect your portfolio leading up to, during, and after a market crash. For this, let's take a look at the S&P 500 over time. History shows us, as we can see in the chart below, that after every decline and market crash, the S&P 500 always has recovered and climbed in the years to follow.
^SPX data by YCharts
The S&P 500 has gained over time
On some occasions, recovery has come quickly. On others, it's taken more time. But the S&P 500 has always delivered a win to investors who have held on. This tells us that the one move you should make is the following: Hold onto your quality stocks throughout market environments.
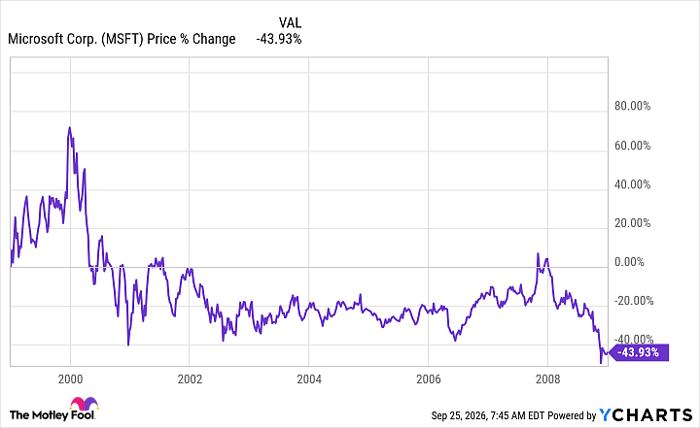
Here's an example. If you bought Microsoft stock right before the 2007-2008 financial crisis and held on during that period, you would have seen a 34% loss on paper.
You could have sold at that point, and if you'd originally bought in 1999 or later, you would have lost money.
MSFT data by YCharts
However, if you held on through the crisis and through today, you would have gained more than 1,300%. This doesn't mean that you have to hold onto every stock for more than two decades -- in many cases, you could score a significant win by holding on for five to 10 years. And when a particular sector, such as tech, goes through a rough period, you might hold on for a few extra years, knowing the stock may need that extra time to enter a new phase of growth.
To ensure that this strategy works, it's crucial to buy quality stocks with solid long-term prospects. These companies have the strength to manage tough times and win in the long run.
So, whether the next market crash is around the corner or farther down the road, don't worry. History says one simple move -- being willing to hold onto quality stocks for the long term -- could make you an investing winner.
Should you buy stock in S&P 500 Index right now?
Before you buy stock in S&P 500 Index, consider this:
The Motley Fool Stock Advisor analyst team just identified what they believe are the 10 best stocks for investors to buy now… and S&P 500 Index wasn’t one of them. The 10 stocks that made the cut could produce monster returns in the coming years.
Consider when Netflix made this list on December 17, 2004... if you invested $1,000 at the time of our recommendation, you’d have $383,680!* Or when Nvidia made this list on April 15, 2005... if you invested $1,000 at the time of our recommendation, you’d have $1,382,954!*
Now, it’s worth noting Stock Advisor’s total average return is 937% — a market-crushing outperformance compared to 214% for the S&P 500. Don't miss the latest top 10 list, available with Stock Advisor, and join an investing community built by individual investors for individual investors.
See the 10 stocks »
*Stock Advisor returns as of September 27, 2026.
Adria Cimino has no position in any of the stocks mentioned. The Motley Fool has positions in and recommends Microsoft. The Motley Fool has a disclosure policy.
Recommended Articles


