


Tesla Stock Outlook: Investment-Grade Rating Meets $25 Billion AI Spending Push
TradingKey - This Friday, Tesla (NASDAQ: TSLA) has substantial liquidity and a new credit rating. Fitch rates Tesla's creditworthiness for the first time at BBB with a stable outlook. According to Fitch, Tesla's position in the EV market, as well as the company's cash and liquidity, help support the rating. Additionally, Fitch cited Tesla's business strategy to expand into AI and other related hardware.
Fitch’s BBB Rating Supports the Balance-Sheet Story
Fitch's rating also means that Tesla has its first official investment-grade rating from Fitch, but not its first official investment-grade rating from any of the major credit agencies.
As of the end of the second quarter, Tesla reported cash, cash equivalents and short-term investments of $43.5 billion. The company is using that liquidity to support a major investment cycle across AI, manufacturing and infrastructure.
While Fitch's rating supports Tesla's financing and balance-sheet story, it will put additional pressure on management to provide evidence that suggests further investment into AI and related hardware will be accretive to the bottom line.
It does not prove that Cybercab, robotaxi services, AI infrastructure or Optimus will be profitable with the current level of investment.
The $25 Billion Figure Is Total CapEx, Not Pure AI Spending
Tesla is projecting capital expenditures for 2026 in excess of $25 billion. Tesla says that spending includes construction of company-owned retail, service, and charge stations as well as data and computing centers. Additionally, it includes expenses for the design, construction and equipment of manufacturing and research and development facilities.
AI-related spending is expected to be only a portion of the total 2026 capital spending. First-half 2026 capital spending was $8.28 billion compared to $3.89 billion for the same period last year. To spend more than $25 billion this year, Tesla needs to spend more than approximately $16.72 billion in the second half of 2026.
Free Cash Flow Is Already Tight
Tesla generated $8.63 billion in operating cash flow for the first half of 2026.
After $8.28 billion in capital expenditures (capex), the simple operating-cash-flow-minus-capex calculation leaves about $350 million of first-half free cash flow.
Management has expressed concern about the need to fund increasing capex, and Fitch has a similar view regarding free cash flow.
The main concern for me is the potential need for additional funding during periods of heightened capital spending. Management must finance the project and avoid a cash flow gap.
Vehicle Growth Still Funds the Transition
In the second quarter of 2026, Tesla delivered 480,126 vehicles (an increase of 25% from the prior year) and 13.5 GWh of energy products.
Revenues for the quarter increased 26% to $28.24 billion, with a 27% increase in automotive sales revenue to $20.01 billion.
Operating income decreased to $398 million from $923 million in the prior year quarter.
Tesla incurred increasing research and development costs (an increase of 49% to $2.37 billion for the quarter), primarily due to costs related to Artificial Intelligence (AI) and other projects. The automotive gross margin decreased to 16.9% from 17.2%.
These cost inflation pressures negatively impacted operating profit, and are the primary consideration in the valuation of the stock.
Services Growth Should Not Be Confused With Robotaxi Revenue
Tesla said the main reasons for the growth in services and other revenues was increase in sales of used vehicles, maintenance and repairs, and supercharging.
Because of this, investors should not read anything into the services and other revenues segment regarding the commercialization of Tesla’s Artificial Intelligence (AI) and Robotaxi services.
Tesla is using its entire fleet to provide a variety of services, produce vehicles, and generate supercharging revenue. Until Tesla’s AI services and/or Robotaxis services, produce a meaningful revenue stream, the Revenues generated from Services and Other segment should not be viewed positively by investors.
Cybercab and Optimus Are the Biggest Upside Variables
According to Tesla, Cybercab production began in the first half of 2026.
Also in 2026, Tesla expects to begin Optimus production later in the year, although it no longer guides to 2026 volume production.
These two products give investors the most optimism about the future of Tesla because they give the company the opportunity to move beyond the vehicle business and into Mobility and Robotics.
The problem is that, for these products, Tesla will have to figure out how to produce products that the market will accept.
The things that will move the stock the most are the deployment of Cybercabs and other Robotaxis, and the start of Commercial Production of Optimus.
What Would Strengthen the Bull Case
My near-term outlook remains cautious, but I am constructive on the company’s financial flexibility. I would be neutral to bullish if there were improvements in company operating margins and cash flow, with evidence of expanding revenues from Cybercabs and Artificial Intelligence (AI) businesses. I would be neutral to bearish with continuing high capital expenditures and negative free cash flow.
Fitch crediting the company for financing the capital expenditures to reposition the business is one element; demonstrating the repositioned business is financially profitable and improves the company’s return on capital would address the other element.
Tesla Technical Analysis: TSLA Holds Rising Channel as $384.59 Breakout Comes Into Focus
Tesla’s 4-hour chart is constructive, with the price recovering from the July lows and moving within a rising trend channel. The 61.8% Fibonacci level is at $368.84. Currently, RSI is around 64. Although this is above the signal line (currently at 56), it is still below 70 overbought levels. As such, further upside potential remains. In the short-term, the upside potential is capped by the 4-hour resistance at $384.59. A break above this level would give a sign to the upside to $399.98, and then to the larger $412.90-$413.02 resistance region.
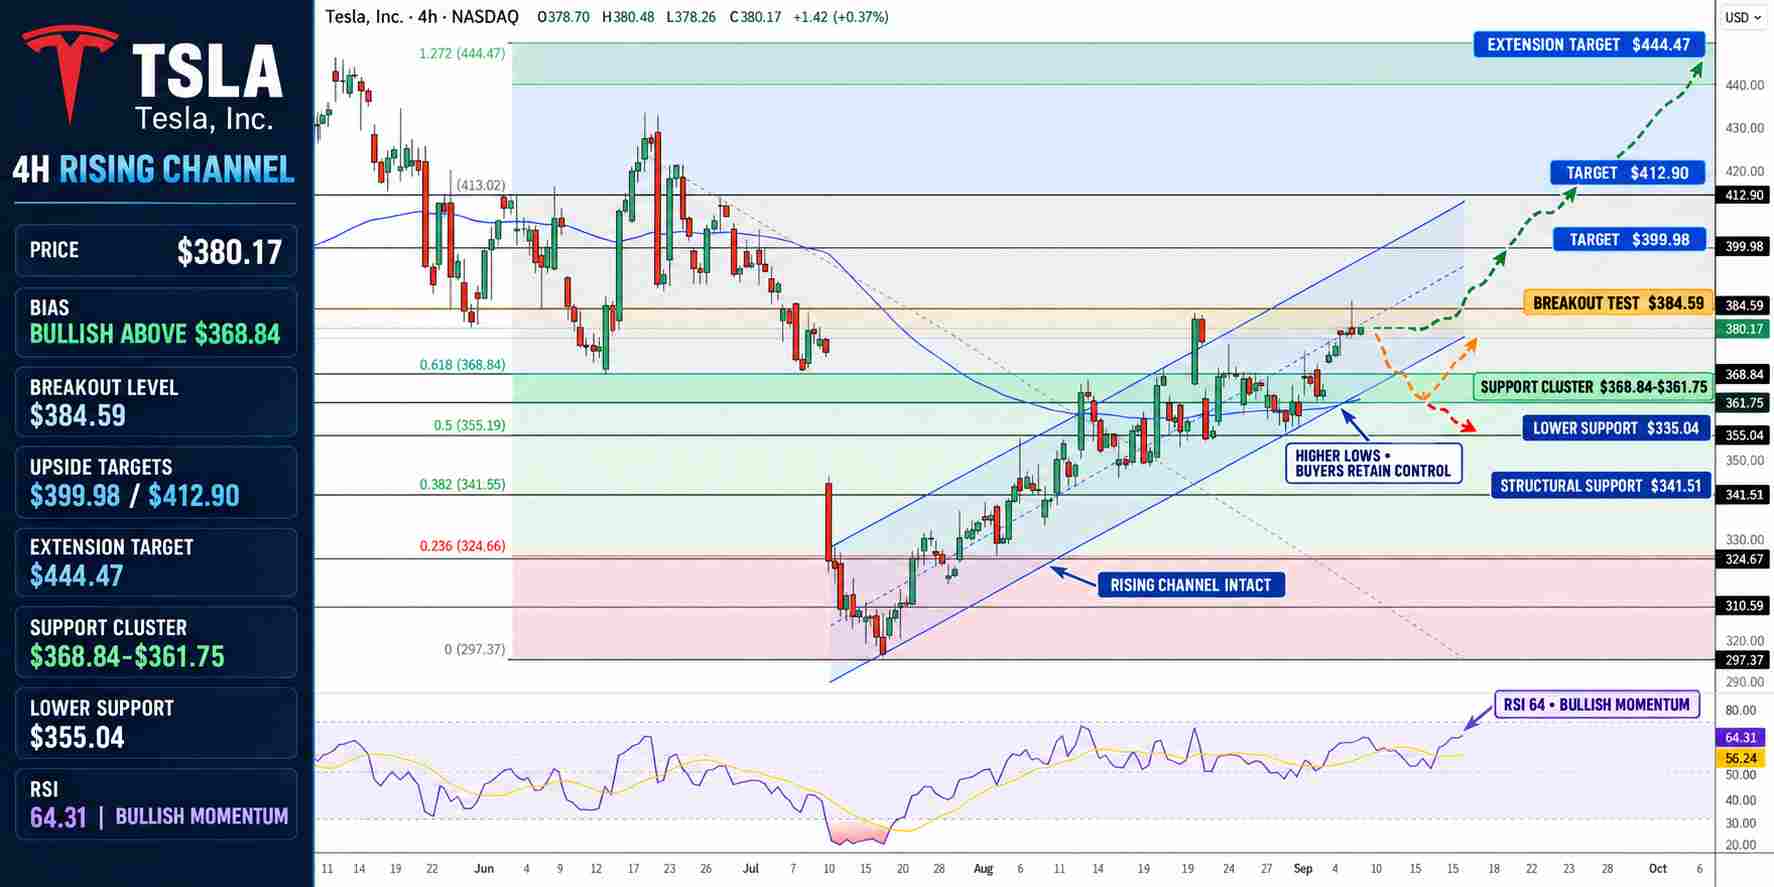
Tesla Stock Price Chart - Source: Tradingview
On the downside, the short-term support region is located at $368.84, with additional support located at the moving average at $361.75, and then at $355.04. A closure below $355.04 would break the rising trend-line from the lows and increase the potential for a larger decline to the $341.51 region.
On the other hand, my primary view is that as long as $368.84 holds, the primary trend is still up, with the first key upside target located at $384.59. RSI is currently at 64, with the more bearish signal line at 56. As such, the 4-hour timeframe is biased up, with an upside target of $399.98.
Why is Tesla stock in focus now?
Tesla is in the spotlight because Fitch rated the company’s debt for the first time at ‘BBB’, and the company has plans to spend more than $25 billion in 2026 to build artificial intelligence, manufacturing, and other infrastructure and related projects and services.
What level confirms a stronger TSLA breakout?
Traders should look for a close above $384.59 to confirm that higher prices are in play and to validate the upside target at $399.98 and $412.90. If the price of TSLA closes below $355.04, the up trending channel would come into question.
Bottom Line
Tesla has improved its credit worthiness, but has increased the skepticism on its expenditures.
Fitch's rating recognizes that Tesla is likely able to finance its projects, but is that the only rating that the company needs? The company needs to show returns on its investments in Cybercab, autonomy, and Artificial Intelligence.
Although the $355.04 price is currently providing support, a break of $355.04 and a drop below $355.04 would be bearish and increase the risk of a move toward $341.51. A breakout above $384.59 would instead validate the upside targets at $399.98 and $412.90-$413.02.
Recommended Articles


