


Apple Stock Forecast: $5 Trillion Milestone Meets New iPhone Growth Cycle
TradingKey - Apple (AAPL) has nearly $5 trillion worth of reasons to be bullish this week. AAPL crossed the $5 trillion market cap on Tuesday, September 22, but was unable to sustain it. Touching $5 trillion is a significant accomplishment regardless, with Apple’s closing price on the 23rd at $337.02. The real question now is if recent and upcoming releases will allow Apple to keep this market cap, rather than just touch it.
Apple Briefly Crossed $5 Trillion, but Did Not Hold It
On Tuesday September 22nd, Apple reached a new all time high of $345.34 giving the company a valuation of about $5.04 trillion using Apple’s reported July 17 share count. The closing price that day was $339.75.
At Apple’s reported July 17 share count of 14.594 billion, the valuation of $5 trillion equates to $342.60.
Of course, the figure of $342.60 isn't an exact target, but rather a line in the sand, of sorts. As Apple repurchases stock, that threshold will continue to move.
On September 23rd, Apple closed at $337.02, giving the company a valuation of roughly $4.92 trillion using the same reported share count.
The iPhone 18 Pro Cycle Has a Strong Starting Point
Apple has positive iPhone trend lines as they head into their major product cycle. In the third quarter, revenue from iPhones jumped 22% from the year prior to $54.25 billion with especially strong sales for the Pro models. Overall, revenue for the quarter jumped 16% to $109.42 billion and earnings per share improved 29% to $2.02.
Strong Pro model sales bode well for the cycle as Apple is historically pretty successful at upselling the higher priced models.
The new Pro models hit the shelves on September 18. Depending on the improvements made to the camera and other internal components as well as the A20 processor and Siri AI, the new models could justify an upgrade.
iPhone Duo Is a Later Holiday-Quarter Catalyst
U.S. based consumers can purchase Apple's first foldable iPhone Duo for a starting price of $1,999. Preorders for the phone begin on October 16 and it reaches stores on October 23. The Duo will not be a significant contributor to the quarter due to its October release. Nevertheless, expect the Duo to positively impact Apple's holiday quarter results.
If the Duo becomes a runaway success, other iPhone customers may be incentivized to purchase the new higher end iPhone models, thus creating a positive cycle for future iPhones. The success of the Duo may also be short-lived. It may turn out the Duo only appeals to a niche market of consumers. Apple will find out more during the holiday quarter.
Services and China Broaden the Growth Case
Services revenue grew by 12% to $30.74 billion in fiscal Q3. With services gross margin at 75.6%, products gross margin at 40.1%, and expected fluctuation in hardware gross margin, the services segment provides a protective cushion to overall gross margin.
Revenue from Greater China grew by 22% to $18.82 billion, and those Q3 results predated the latest iPhone launch, so the region will be important to watch as the new models ramp.
As new iPhones are released, the Greater China region and other international markets become even more important in evaluating customer demand for iPhones, especially if the region helps reinforce the price premium for iPhones.
Cash Flow and Buybacks Still Matter
During the first three quarters of fiscal 2026, Apple recorded $117.0 billion cash flows from operations and used $62.1 billion to repurchase shares.
Share repurchases help reduce the share count and increase earnings per share, and over time further reduce the share count needed to achieve a $5 trillion market capitalization. The ability to fund a significant share repurchase program remains a competitive edge for Apple.
The Margin Comparison Needs Care
According to Apple, Q3 gross margin was 50.1%, including a favorable impact of approximately 2 percentage points from tariff refunds. Tariff refunds also added about 11 cents to EPS. Apple's profitability benefited from a potentially non-recurring favorable factor, while higher memory costs remained a negative factor. The effect of tariff refunds on Apple's bottom line will likely be smaller next quarter. Strong top line numbers will be negative if Apple's profitability suffers because of the introduction of a new, lower-end product. I'm particularly interested to see how gross margins are impacted next quarter.
What Would Confirm a Stronger Apple Growth Cycle
My assumptions are based off the fundamental view that the cycle of profitability will be stronger.
Prior to the product launch, iPhone revenue was up about 22% year over year in fiscal Q3 and Apple has a positive outlook. The holiday season will also be aided by the release of the high-end iPhone 18 Pro as well as the new, higher-end iPhone Duo.
I will also be watching to see if the Pro iPhons cannibalize the sales of the Duo. The strength of Pro and Duo iPhone sales will also need to offset pressure from rising component costs. I will also be watching to see if gross margin takes a substantial hit.
Apple Technical Analysis: AAPL Holds $328.65 as Bulls Eye $344.38 Breakout
AAPL has recently closed at $337.02. The 4 hour chart shows a bullish structure with the price touching progressively higher lows and being supported by a rising trendline. The zone between $328.65 to $332.38 has recently acted as a former resistance area that now provides support.
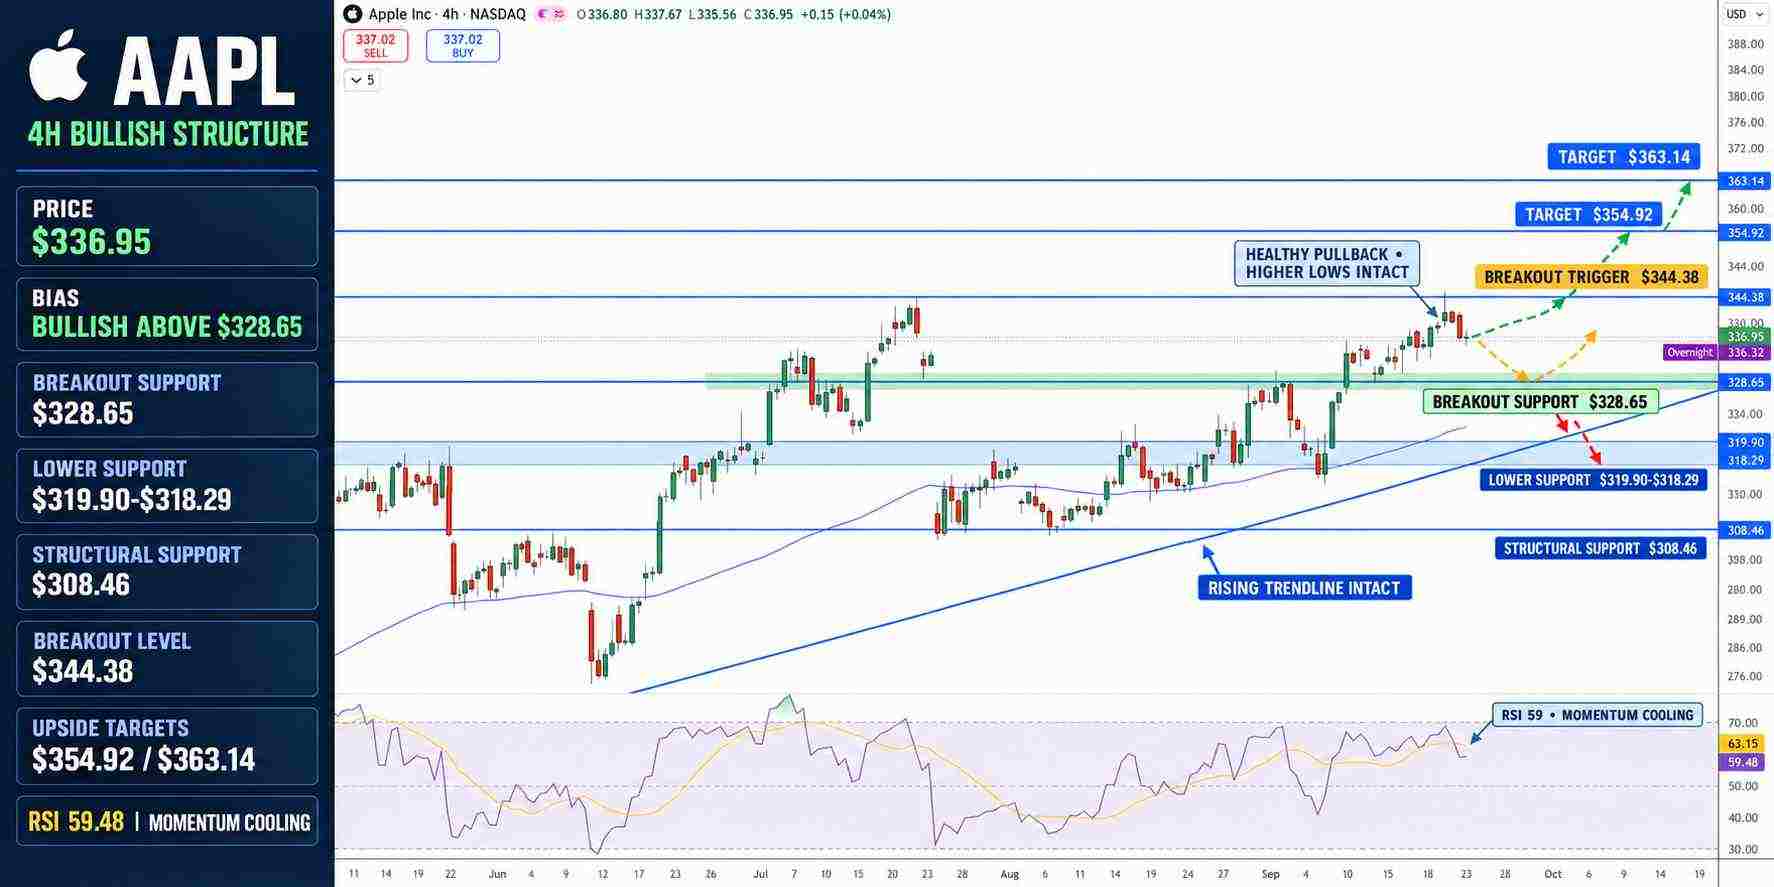
Apple Stock Price Chart - Source: Tradingview
The Relative Strength Index (RSI) is at 59 and showing a slight decline after recently touching the overbought zone.
The next major level of resistance is at $344.38. A break above this level would confirm a bullish continuation and have a next target at $354.92.
The level at $328.65 remains a major support level. A break below this level would open up lower levels at $319.90, $318.29, and $308.46.
I expect AAPL to continue trading in a bullish pattern as long as it is above $328.65, with a near term upside target of $344.38.
Key Levels
• Closing price: $337.02
• Support: $328.65 to $318.29, $308.46
• Resistance: $344.38 to $354.92, $363.14
• RSI: 59
Why is Apple stock in focus now?
AAPL has been in focus as the company began a new cycle of the iPhone and momentarily touched a market cap of $5 trillion. The iPhone 18 Pro is currently available and the Duo will be available for pre-order on October 16.
What level confirms a stronger AAPL breakout?
If the stock trades above $344.38 on the 4 hour time frame, this would represent a clear break above a major resistance level and added focus on the $354.92 level. A move below $328.65 would change the near term trend from up to down.
Bottom Line
Apple is set to benefit from some positive product releases, improve cycle trends, and the continued strength in the Services division.
Reaching the $5 trillion valuation is important, but the stock briefly traded above the level and did not sustain it. Moreover, the company will be assessed based on the performance and trends with the recently released devices as well as the Duo, and their gross profits.
Currently, as long as the stock trades above the $328.65 level, the overall trend will be viewed as bullish. A move above the $344.38 level will bring the $354.92 level into focus, and a move below the $328.65 level would be bearish.
Recommended Articles


