


Here's Why I Like This Copper ETF More Than Ever
Key Points
Zero new copper deposits were found last year, putting upward pressure on prices.
In fact, it takes almost 18 years for a new copper deposit to reach the production point.
- 10 stocks we like better than Global X Funds - Global X Copper Miners ETF ›
Pair soaring demand with shrinking supply -- of any asset or commodity -- and what do you get? Higher prices.
That's exactly what is happening to copper right now, and the supply-demand ratio is becoming even more unbalanced. According to S&P Global, 263 major copper deposits were discovered between 1990 and 2025. But the vast majority of those came in the 1990s, with new discoveries in the double digits in most years of that decade.
Missed AI’s "Act 1"? Act 2 Could Be 15x Bigger. Most investors think they missed the AI boat because they didn't buy Nvidia in 2005. But according to our analysts, we’re only at the end of "Act 1"—the R&D phase. "Act 2" is the global rollout. Continue »
In recent years, however, the number of deposits discovered has fallen to zero. From 2021 to 2025, there was just one discovery each year, and none in 2025.
And even if new deposits are found in the next few years, they won't produce anything for a long time. It takes, on average, 17.5 years for a new deposit to reach production. The permitting processes are prolonged and complex, and newer deposits tend to be much deeper in the earth, so they require more time and cost more to develop.
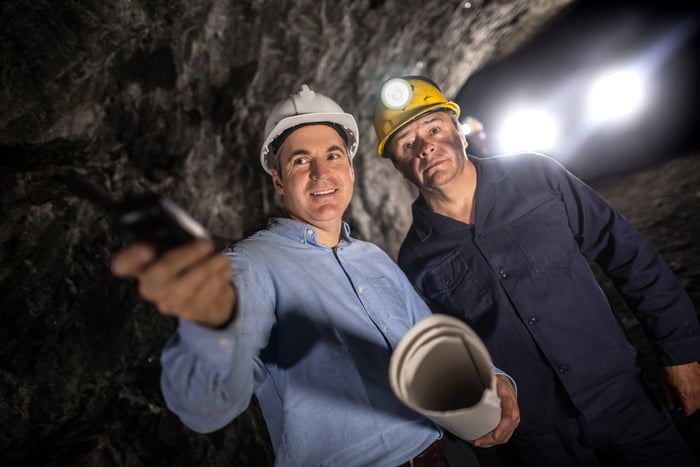
Image source: Getty Images.
Meanwhile, demand for the red metal is soaring. The massive investment into artificial intelligence (AI) data centers cannot continue without copper. It provides miles and miles of wiring connecting these massive facilities, along with many other electrical components. A traditional data center requires between 5,000 and 15,000 tons of copper, according to the Copper Development Association. AI data centers can need up to 50,000 tons of copper per facility.
That's in addition to other major technologies that require lots of copper, including solar power and electric vehicles.
The price of copper has been climbing this year
That's exactly why the price of copper climbed 48% over the past year, from about $4.63 a pound to about $6.89 a pound in early September, an all-time high. As I write this, it's a few pennies off that record high.
That's why I like the Global X Copper Miners ETF (NYSEMKT: COPX). It provides investors with access to a broad range of copper mining companies. The fund currently has net assets of about $8.4 billion. It holds around 44 different copper miner stocks, including companies like Freeport-McMoRan, Hudbay Minerals, and Southern Copper, with no one stock accounting for more than 6% of the fund. The exchange-traded fund (ETF) is up about 24% this year and 64% over the past year.
I don't doubt that copper prices, and thus the price of COPX, could give back some of their recent gains as investor enthusiasm for AI-related stocks waxes and wanes. But in the longer run, I see that supply-demand imbalance and the long lag time to develop new mines to feed the insatiable need for copper from the AI build-out.
Should you buy stock in Global X Funds - Global X Copper Miners ETF right now?
Before you buy stock in Global X Funds - Global X Copper Miners ETF, consider this:
The Motley Fool Stock Advisor analyst team just identified what they believe are the 10 best stocks for investors to buy now… and Global X Funds - Global X Copper Miners ETF wasn’t one of them. The 10 stocks that made the cut could produce monster returns in the coming years.
Consider when Netflix made this list on December 17, 2004... if you invested $1,000 at the time of our recommendation, you’d have $386,781!* Or when Nvidia made this list on April 15, 2005... if you invested $1,000 at the time of our recommendation, you’d have $1,379,943!*
Now, it’s worth noting Stock Advisor’s total average return is 936% — a market-crushing outperformance compared to 213% for the S&P 500. Don't miss the latest top 10 list, available with Stock Advisor, and join an investing community built by individual investors for individual investors.
See the 10 stocks »
*Stock Advisor returns as of September 25, 2026.
Matthew Benjamin has positions in Global X Funds-Global X Copper Miners ETF. The Motley Fool has no position in any of the stocks mentioned. The Motley Fool has a disclosure policy.
Recommended Articles


